
 En
En  De
De


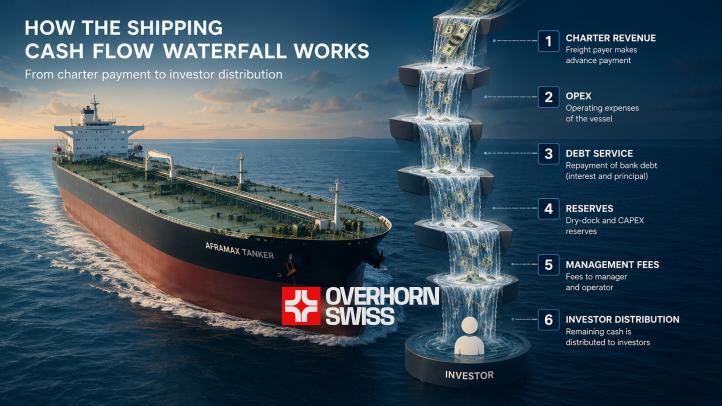
The Money Exists. But Where Is It?
An Aframax-class tanker is sailing from Rotterdam to Houston. On board - 80,000 tons of crude oil. The charterer has transferred the next advance payment under the time charter. A six-figure sum has left their account and formally become the vessel's revenue. The investor opens their banking app. It's empty. Or rather, not empty - but nothing like what they expected to see.
Sound familiar? This is precisely where most investors entering maritime assets for the first time encounter their main misconception. They think money moves in a straight line: the charterer pays - the investor receives. In reality, the journey of that money is a cascade. Multi-tiered, strictly structured, with a clear order of priority at each level.
That is exactly why the model is called a "waterfall" (cash flow waterfall). Water bypasses no ledge. Neither does money.
Understanding this cascade means understanding the real economics of maritime investment. Not the version drawn up prettily in a pitch deck. But the one that determines the number in your account at the end of the quarter.
That is what this article is about. We will work through each level of the waterfall from top to bottom: from the moment the charterer clicks "pay" to the moment the distribution is credited to the investor. No oversimplifications, but no padding either.
This is where the waterfall begins.
Where the First Dollar Comes From: The Anatomy of Charter Revenue
Before money starts falling down the cascade, it first needs to be earned. That sounds obvious - but it is precisely at this stage that many investors operate with figures that bear only a tenuous relationship to reality.
Most structured maritime investments are built around a time charter (TC). This is no accident. A time charter gives the investor what they value most: predictability. The charterer takes the vessel on hire for a fixed period - from several months to several years - and pays an agreed daily rate regardless of whether the vessel is sitting in port or steaming at full speed. Fuel and port costs are their problem. The vessel's OPEX is the shipowner's problem. This is a critical distinction we will return to.
But here is the catch. The time charter rate and the vessel's actual revenue are not the same number. Between them stands a metric that professionals call TCE - Time Charter Equivalent.
What TCE Is and Why It Matters
TCE is a standardized measure of a vessel's daily revenue, net of voyage costs. It allows vessels operating under different charter types - time charter, voyage charter, and spot market - to be compared on a like-for-like basis.
The formula is straightforward:
TCE = (Freight Revenue - Voyage Costs) / Number of Revenue Days
Voyage costs include:
- bunker (fuel) costs - the most volatile line item;
- port dues and canal transit fees;
- agency commissions.
Under a clean time charter, these costs are borne by the charterer, so TCE is essentially equal to the daily rate. Under a voyage charter, they are borne by the shipowner, and TCE can differ significantly from the nominal freight rate. This is exactly why, when comparing fleet earnings, one must always look at TCE, not the headline rate.
Who Pays and When
The payment schedule under a time charter is strictly regulated. The BIMCO standard provides for advance payment every 15 days - meaning the charterer pays upfront for the next billing period. This is critically important for fund liquidity management.
How this rhythm looks in practice:
| Parameter | Standard |
|---|---|
| Payment frequency | Every 15 days, in advance |
| Base currency | USD |
| Point at which payment right arises | From vessel delivery |
| Basis for deduction | Off-hire periods (downtime due to shipowner's fault) |
| Payment default | Shipowner's right to withdraw the vessel |
Market Context: Where Rates Come From
Time charter daily rates do not appear from thin air. They are formed by the market - and reflected in the Baltic indices published daily by the Baltic Exchange:
- BDTI (Baltic Dirty Tanker Index) - for crude oil and fuel oil;
- BCTI (Baltic Clean Tanker Index) - for refined petroleum products.
Rates are cyclical. In 2022, against the backdrop of the energy crisis, daily rates for Aframax vessels reached $90,000-100,000 per day. During quieter periods, the same tanker earns $15,000-25,000. This volatility is a fundamental feature of the market. It is precisely why a 2-3 year time charter at a fixed rate is valued by investors: it removes this risk from the equation.
Because the rate on paper and the rate "in hand" are different numbers. And this is only the beginning of the journey. Next - the first ledge of the waterfall.
The First Level: The Operating Machine Takes Its Share
Many investors think OPEX is just a line in an Excel spreadsheet. In reality, it is a living organism that knows how to surprise. Sometimes very unpleasantly.
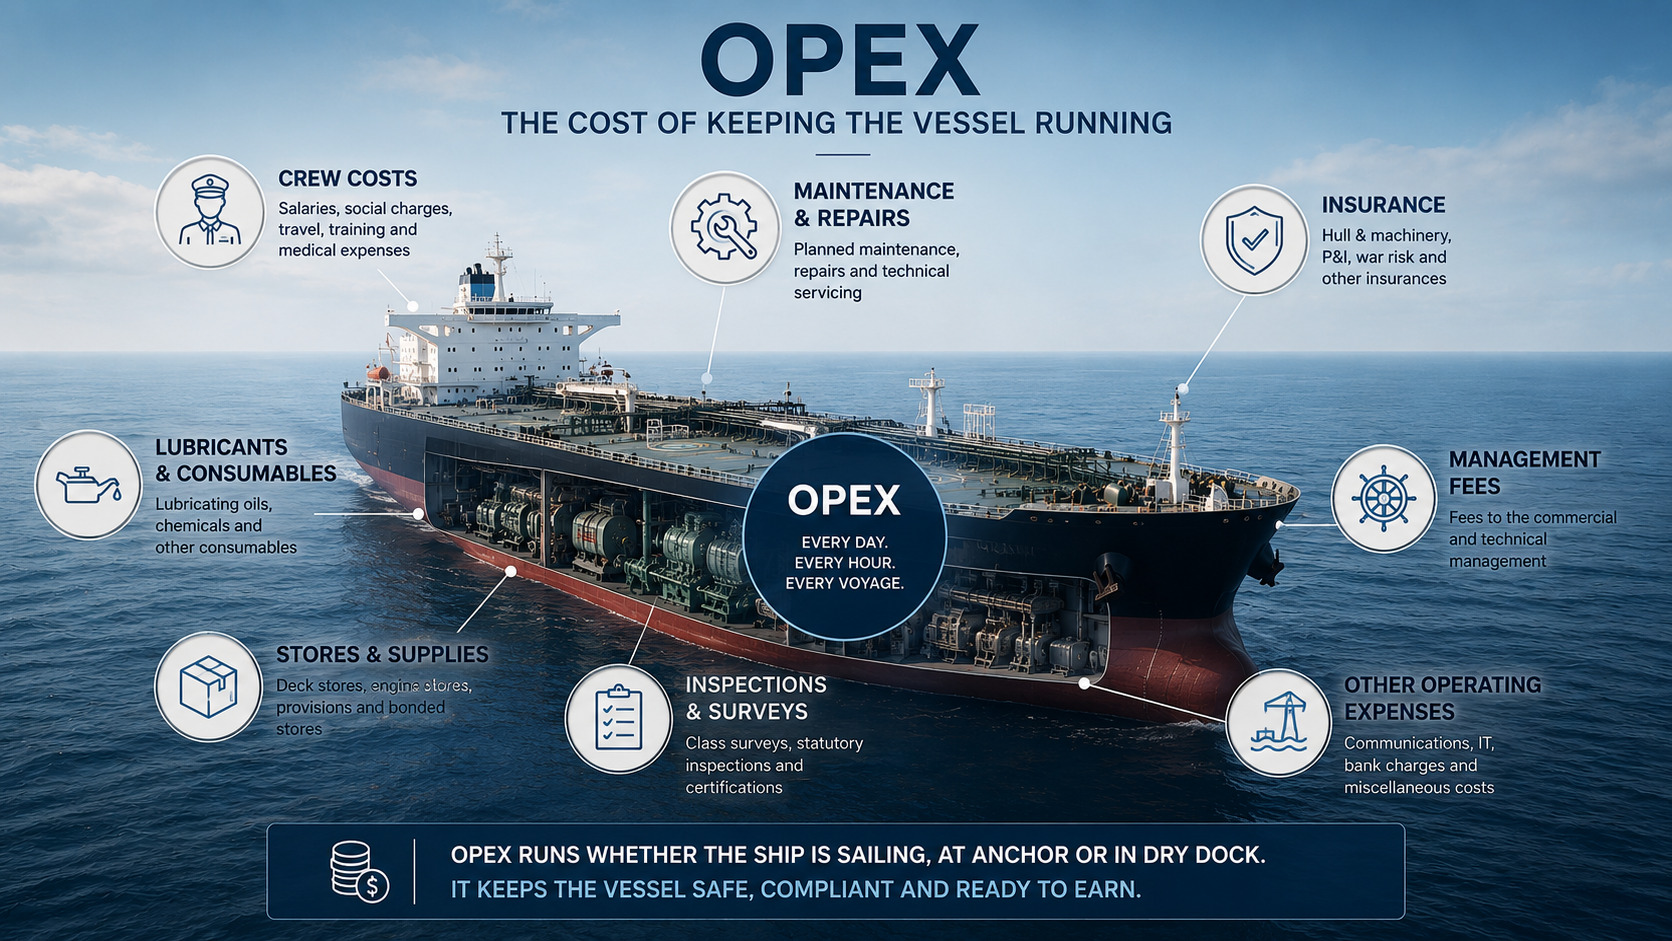
OPEX (Operating Expenditure) is the aggregate of daily operating costs for maintaining a vessel. These arise regardless of whether the vessel is working, lying at anchor, or undergoing maintenance. As long as the vessel exists - OPEX runs. This is why it holds absolute priority in the waterfall chain: without covering operating costs, the vessel simply ceases to function.
What Tanker OPEX Consists Of
The operating cost structure for the tanker fleet is standardized and includes several key components:
| OPEX Item | What It Includes | Share of Total OPEX |
|---|---|---|
| Crew | Wages, repatriation, training, medical | 40-50% |
| Maintenance and repairs | Planned preventive maintenance, spare parts | 15-20% |
| Insurance | P&I (liability) + H&M (hull and machinery) | 10-15% |
| Lubricants | Oils, technical fluids | 3-5% |
| Ship's stores | Provisions, inventory, rigging supplies | 3-5% |
| Flag registry and inspections | Classification society fees, flag state charges | 3-5% |
| Management company | Ship management fee | 8-12% |
Benchmarks by Vessel Type
To give these numbers concrete grounding, here are real-world daily OPEX benchmarks for the main tanker classes. The data reflects professionally managed fleets under European management:
- MR tanker (Medium Range, 45,000-55,000 dwt) - $7,000-9,500 per day;
- Aframax (80,000-120,000 dwt) - $9,000-12,500 per day;
- Suezmax (120,000-200,000 dwt) - $11,000-14,000 per day;
- VLCC (Very Large Crude Carrier, 200,000+ dwt) - $13,000-17,000 per day.
These figures represent the floor a tanker must earn just to cover the cost of its own operation. Everything above that moves further down the waterfall. Everything below means the vessel is operating at an operating loss.
Off-Hire: When the Waterfall Stops
A separate issue is off-hire periods. This is time when the vessel is unavailable to the charterer for one reason or another: unplanned repairs, equipment failure, delays at a PSC (Port State Control) inspection. During these days the charterer is legally entitled not to pay. But OPEX continues.
The consequences of off-hire for the investor:
- loss of charter revenue for every day of downtime;
- simultaneous accrual of operating costs in full;
- possible emergency repair costs beyond planned reserves;
- reputational risk from frequent incidents - the charterer may decline to renew the contract.
This is precisely why technical ship management is not an administrative function. It is a direct financial lever. A professionally managed tanker shows a utilization rate above 97-98%. A poorly managed one can "consume" 5-10% of potential revenue through off-hire and above-budget repairs. Over a five-year investment horizon, this is a critical difference in returns.
The role of the management company is most fully apparent here. Because the difference between "vessel underway" and "vessel in repair" is not technical. It is financial. And it is measured in thousands of dollars every single day.
OPEX is covered. The machine is running. Next in line is the one who has been waiting from the start and has no intention of yielding.
The Second Level: The Bank Stands First in Line
The bank is not a partner. It is infrastructure with priority.
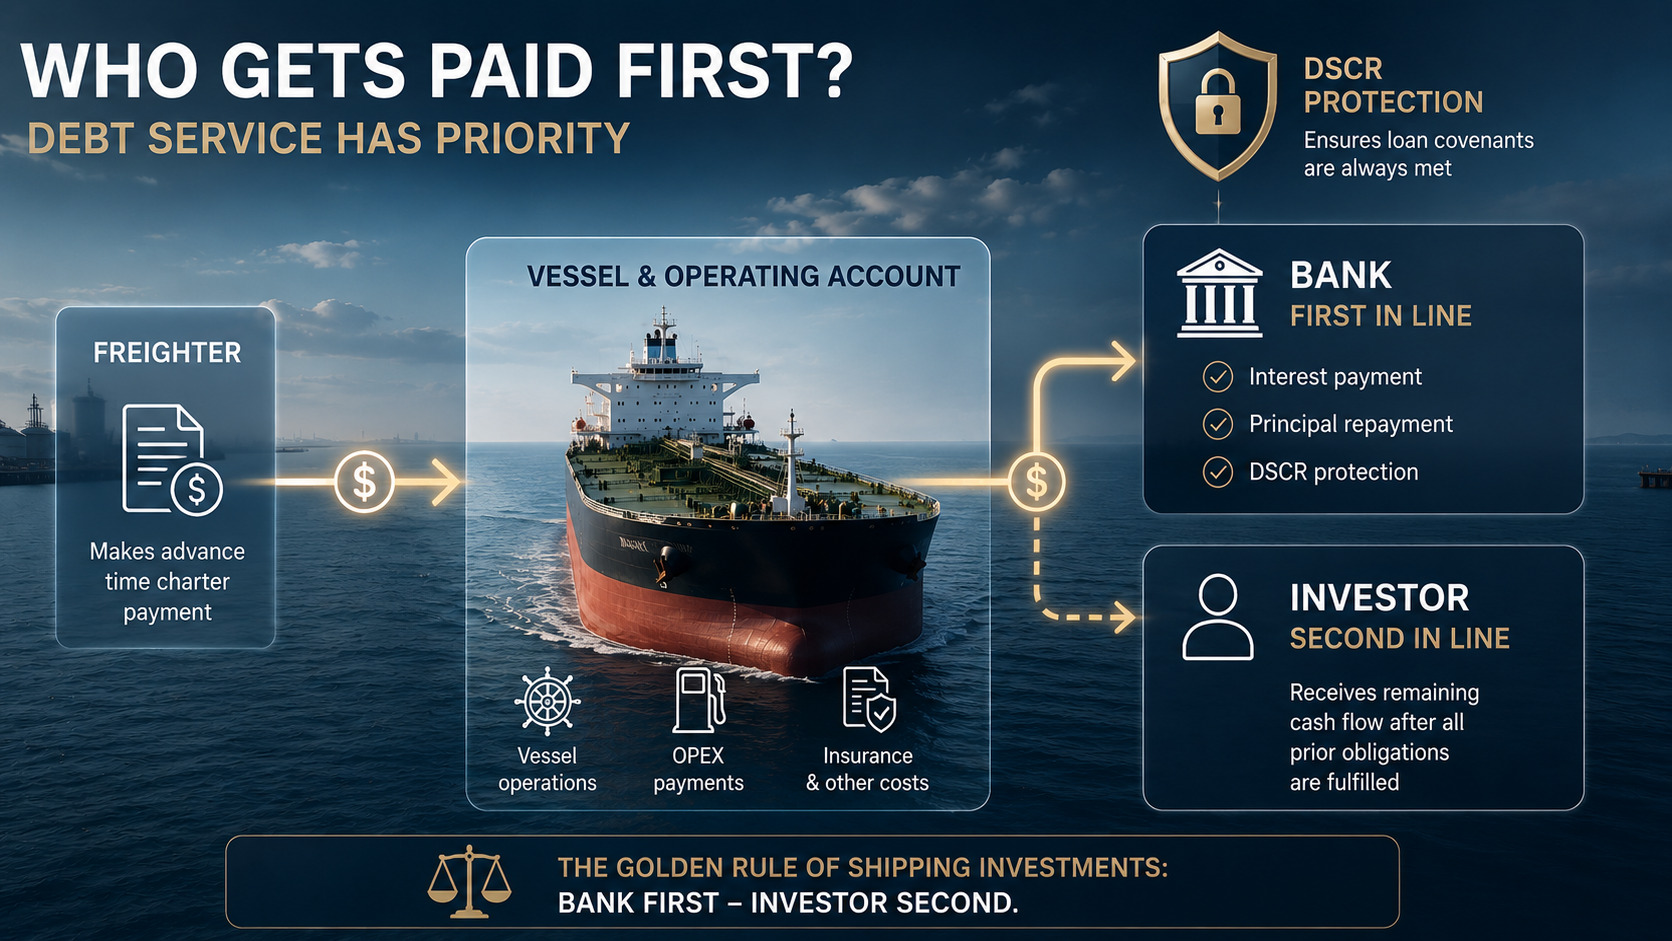
Most tanker acquisitions are partially financed with debt. This is standard practice - ship finance allows investors to enhance returns on equity through leverage. But this instrument comes with a hard condition: the bank gets paid before everyone else. Without negotiation.
How Ship Finance Works
A typical tanker acquisition transaction is structured as follows:
| Parameter | Typical Terms |
|---|---|
| LTV (Loan-to-Value) | 50-65% of vessel value |
| Loan term | 5-10 years |
| Amortization | Straight-line or balloon structure |
| Interest rate | SOFR + bank margin (1.5-3.0%) |
| Payment frequency | Quarterly |
| Security | Mortgage on vessel, pledge of SPV shares, assignment of charter |
Note the last line. Assignment of the charter agreement is a direct transfer to the bank of the right to receive charter payments in the event of borrower default. In other words: if problems arise, the bank can intercept the cash flow before it reaches the fund's account. This is why understanding the debt structure is a mandatory part of due diligence for any investor.
How Debt Service Works
Every quarter, a loan repayment goes out from the vessel's operating account. It consists of two parts:
- Principal - the scheduled repayment of the loan principal in accordance with the amortization schedule;
- Interest - accrued for the period on the outstanding loan balance.
Under a balloon structure, the bulk of the principal is repaid at the end of the term in one large payment. This reduces the current pressure on cash flow, but creates a refinancing risk at the final stage - especially if the vessel's market value has fallen by then.
DSCR: The Metric Everything Depends On
The key metric in the relationship with the bank is the DSCR - Debt Service Coverage Ratio. This is the ratio of operating cash flow to the mandatory debt payment for the same period.
DSCR = Operating Cash Flow / Debt Service (principal + interest)
What different DSCR values mean in practice:
| DSCR Value | Interpretation | Consequences |
|---|---|---|
| Above 1.30 | Comfortable zone | Distribution to investor permitted |
| 1.10-1.30 | Working zone, possible restrictions | Bank may require additional monitoring |
| Below 1.10 | Covenant breach | Cash trap - distribution blocked |
| Below 1.00 | Debt service default | Bank's right to accelerate repayment |
Cash Trap and Distribution Freeze
A DSCR covenant breach automatically triggers the cash trap mechanism. This means the following: all available funds in the fund's account are frozen and redirected toward accelerated debt repayment or into a special reserve account under bank control. The investor receives nothing - until the metrics recover to contractual levels.
In addition to DSCR, banks typically impose other covenants:
- Minimum liquidity - a minimum cash balance to be maintained in the account;
- LTV covenant - if the vessel's market value falls, the bank may require accelerated repayment of part of the loan or additional collateral;
- Insurance covenant - the vessel must be insured for no less than an agreed minimum;
- Flag and class covenant - requirements regarding the flag registry and classification society.
The bank does not lend on trust. It lends under control. And until the debt is repaid, that control is part of the reality for every maritime asset investor. A well-structured deal accounts for this from the outset - and builds in buffers that prevent DSCR from falling to dangerous levels even in adverse market conditions.
The bank has received its share. The waterfall flows on. The next level is quiet, non-obvious, but critically important.
The Third Level: Reserves That "Eat" Returns - and Protect Them
A reserve account is the dullest line in an investment memorandum. And the most important one.
After OPEX is covered and the bank has received its quarterly payment, the next level of the waterfall is reserves. Many investors treat them as a formality - a mandatory structural element that simply reduces current returns. This is a mistake. Reserves are not losses. They are deferred protection against losses of significantly greater magnitude.
Dry Dock Reserve: Money for the Future Drydocking
Every tanker is required under IMO international regulations and classification society requirements (Lloyd's, DNV, Bureau Veritas, and others) to undergo scheduled drydocking every 2.5 years with an intermediate survey, and every 5 years a special survey with a full underwater hull inspection.
Drydocking is a costly undertaking. Typical costs by vessel class:
| Tanker Class | Cost of Scheduled Drydocking | Recommended Monthly Reserve |
|---|---|---|
| MR tanker | $1.5-2.5 million | $50,000-85,000 |
| Aframax | $2.5-4.0 million | $85,000-135,000 |
| Suezmax | $3.5-5.5 million | $115,000-185,000 |
| VLCC | $5.0-8.0 million | $165,000-265,000 |
These funds are set aside monthly from the first day of operation - long before the vessel enters the dry dock. Because when the drydocking moment arrives, the fund must have the full amount ready. Borrowing it under an emergency credit facility or drawing it from the operating account means creating a cash shortfall at the worst possible moment. And a vessel in dock is not earning anything. It is only spending.
CAPEX Reserve: For When Something Expensive Breaks
In addition to planned drydocking, there are unforeseen capital expenditures. The main engine is one of the most expensive components of a vessel. Its overhaul can cost $1.5-3.0 million. Installing a scrubber (exhaust gas cleaning system to comply with MARPOL sulfur content requirements) costs $3-6 million per vessel. A ballast water treatment system (BWTS) adds another $500,000-1,500,000.
The regulatory burden from IMO has been increasing in recent years. CII (Carbon Intensity Indicator) and EEXI (Energy Efficiency Existing Ship Index) requirements may necessitate technical modifications that were not factored into the budget at the time of vessel purchase. This is why a prudent CAPEX reserve is not excessive caution. It is an essential element of professional fleet management.
Operating Buffer: Liquidity for Periods of Pause
The third type of reserve is the operating buffer. It is needed to cover cash flow gaps: situations where a charter payment is delayed while OPEX and debt service are already due. In practice, funds hold the equivalent of 2-3 months of total expenses in the operating account.
This is not frozen money. It is working capital that ensures the uninterrupted operation of the entire structure.
How Reserves Affect Investor Returns
This is where things get most interesting - and most debated. The level of reserves directly determines the investor's current returns:
- Lower reserves - higher current distributions, higher visible yield. But also a higher risk of unplanned capital draws at the first unexpected event;
- Higher reserves - lower current payouts, but more stable cash flow across the full investment horizon. The vessel drydocks without a cash crisis. The engine is overhauled without an emergency loan.
A professional manager always balances between these two poles. The goal is not to maximize current income, but to ensure a stable cash flow throughout the investment term. Because an investor who receives high distributions in the first two years and then faces zero payouts in the third due to an unplanned drydocking is unlikely to call that investment a success.
Reserves are in place. Buffers are set. The waterfall continues to flow - and the next level takes its share with the precision of a Swiss watch.
The Fourth Level: The Manager Gets Paid
A good manager earns after you do. That is what alignment means.
After OPEX, debt service, and reserve formation, the next recipient in the waterfall is the management company. It is the one making daily decisions that determine how much ultimately reaches the investor: when to put the vessel on a time charter vs. go to the spot market, which charterer to select, how to optimize OPEX, when to sell the asset. This is not an administrative role. It is the role of the chief architect of returns.
Manager compensation is structured in two tiers - and it is precisely this structure that determines how closely the manager's interests align with those of the investor.
Management Fee: The Fixed Base
The first tier is the base management fee. It is fixed, accrues regularly, and is independent of performance. It is typically expressed in one of two ways:
- Percentage of NAV (net asset value of the fund) - usually 1.0-2.0% per annum;
- Fixed fee per vessel - in the case of direct ship management, this is $8,000-15,000 per month per vessel, depending on vessel class and management region.
The management fee covers the operating costs of the management company itself: the analyst team, technical superintendents, lawyers, compliance officers, and accountants. This is the cost of the decision-making infrastructure. It is justified - provided that infrastructure actually performs.
Performance Fee: Compensation for Results
The second tier is the performance fee or carried interest. This is a fundamentally different mechanism. The manager receives it only when the fund exceeds a pre-agreed return threshold - the hurdle rate.
How this works in practice:
| Structural Element | Typical Parameters | Logic |
|---|---|---|
| Hurdle rate | 7-10% per annum on investor capital | Minimum return the manager must deliver before receiving a bonus |
| Carried interest | 15-20% of profit above the hurdle | The manager's share of "excess returns" |
| Catch-up provision | Sometimes included | Once the hurdle is reached, the manager "catches up" to their share more quickly |
| High watermark | Standard for quality structures | Carried interest accrues only on new NAV highs - the manager does not receive a bonus for recovering from losses |
Why the Compensation Structure Is Not a Formality
Many investors view the management fee as a cost line and carried interest as an unavoidable burden. That is the wrong perspective. A properly structured manager compensation arrangement is a mechanism for aligning interests.
Consider this example. If a manager receives only a fixed fee regardless of performance, they have no financial incentive to make difficult decisions: timing spot market entry correctly, selling an asset at the top of the cycle, maintaining tight OPEX control. Why take reputational risks when payment is guaranteed?
The presence of a hurdle rate and carried interest changes the equation entirely. Now the manager earns more only when the investor earns more. This is what alignment of interests actually means - not as a pretty phrase in a presentation, but as a structural element of the deal.
Overhorn Swiss AG: A Model of Transparent Management
It is at this level of the waterfall that structural transparency matters most. Overhorn Swiss AG builds the management of maritime investment portfolios on the principles of institutional governance: a clear separation between fixed compensation and performance-based compensation, regular investor reporting, and compliance with Swiss and European disclosure standards. This is not a declaration. It is a prerequisite for trust, without which long-term capital management in the maritime sector is impossible.
Because an investor who does not understand how and for what they are paying the manager will eventually ask that question at the most inconvenient moment. Better to address it upfront.
The manager has received their share. All intermediate levels have been cleared. What remains is the most important part - the end of the waterfall.
The End of the Waterfall: What the Investor Actually Receives
Here we are. This is the number. Not the one in the pitch deck.
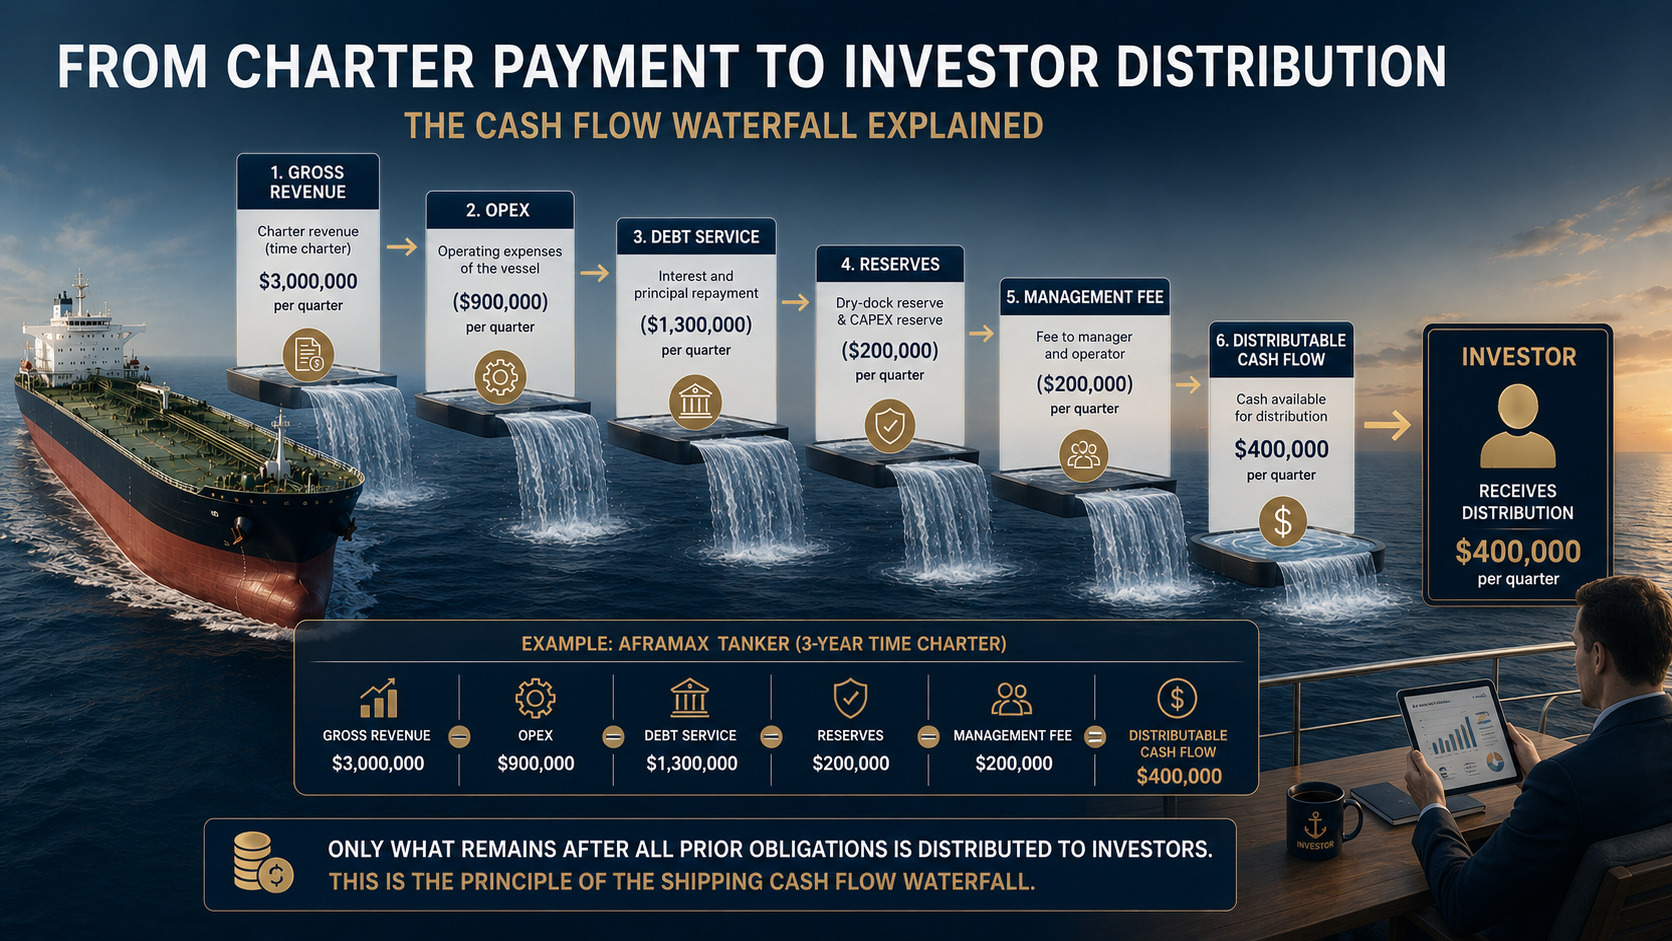
After the waterfall has passed through all its levels - OPEX, debt service, reserves, management compensation - what remains in the fund's account is what is called distributable cash flow. This is the free cash flow available for distribution among investors. It is this that is converted into the quarterly distribution.
How Distributable Cash Flow Is Calculated
The formula for assembling the final figure looks like this:
| Line | Item | Sign |
|---|---|---|
| 1 | Gross charter revenue (TCE x revenue days) | + |
| 2 | OPEX (crew, maintenance, insurance, etc.) | - |
| 3 | Debt service (principal + interest) | - |
| 4 | Dry dock reserve | - |
| 5 | CAPEX reserve | - |
| 6 | Management fee | - |
| 7 | Other fund administrative expenses | - |
| 8 | Distributable cash flow | = result |
A Waterfall in Numbers: Aframax on Time Charter
Let us work through a model example for an Aframax-class tanker (100,000 dwt) operating on a two-year time charter at a fixed rate of $28,000 per day. The calculation period is one quarter (90 days).
| Waterfall Level | Amount for Quarter (USD) | Comment |
|---|---|---|
| Gross charter revenue | +$2,520,000 | $28,000 x 90 days |
| OPEX | -$990,000 | ~$11,000/day x 90 |
| Debt service | -$620,000 | Principal + interest, quarterly payment |
| Dry dock reserve | -$315,000 | $105,000/month x 3 |
| CAPEX reserve | -$90,000 | $30,000/month x 3 |
| Management fee | -$75,000 | ~1.5% NAV per annum / 4 |
| Fund administrative expenses | -$30,000 | Audit, legal, banking costs |
| Distributable cash flow | +$400,000 | ~15.9% of gross revenue |
With an equity investment of $8,000,000 (40% of the vessel's $20 million value at 60% LTV), a quarterly distribution of $400,000 yields an annual cash return of approximately 20% on invested capital. This is the figure under favorable market conditions with a rate above the cyclical average.
During periods of low rates, the same Aframax on the spot market at $14,000-16,000 per day barely covers OPEX and debt service. Distributable cash flow approaches zero or turns negative. This is precisely why a fixed time charter for several years is not merely a convenience. It is protection for the entire waterfall structure.
Cash Yield vs. Total Return: Two Dimensions of Performance
The quarterly distribution is only one component of total maritime investment returns. The second is appreciation in the value of the asset itself (NAV appreciation). Vessels purchased at the bottom of the cycle can show value increases of 30-60% over 3-4 years in a rising market. This is realized at the point of sale on the secondary market (S&P transaction).
The full returns picture looks like this:
- Cash yield - current quarterly distributions from distributable cash flow;
- NAV appreciation - increase in the vessel's market value over the holding period;
- Total return = Cash yield + NAV appreciation at exit.
A professionally managed maritime fund optimizes both metrics simultaneously: maintaining a stable cash flow through sound chartering and keeping a close eye on the secondary market in order to sell the asset at the right point in the cycle.
That is the real return. Not the one in the pitch deck. But the one built from every level of the waterfall - passed through, tested, and transparent.
But before celebrating, it is worth discussing what can break the entire mechanism.
What Can Break the Waterfall
The waterfall can flow in reverse. This is exactly why the management structure is not a formality.
The elegant waterfall model assumes that all inflows are stable, all costs are predictable, and the external environment behaves itself. The real maritime market does not behave that way. Ever. This is one of the most cyclical and geopolitically sensitive sectors of the global economy. Let us look at the risks honestly - without softening.
Off-Hire: When the Machine Stops
We touched on this topic in the OPEX section - but it is important here to show the cumulative effect. For an Aframax at a rate of $28,000, every day of unplanned off-hire means:
- loss of $28,000 in charter revenue;
- continued OPEX of approximately $11,000;
- total cash flow loss per day - approximately $39,000.
Two weeks of emergency downtime amounts to minus $546,000 from the quarterly cash flow. Roughly as much as the entire distributable cash flow in our model example for the quarter. One incident - and the investor is left with no distribution. This is not a catastrophe when reserves are in place. It is a catastrophe when they are not.
Market Cycle: Rates Falling Below Breakeven
The tanker market moves in cycles. Upturns give way to downturns, and downturns to recoveries. The problem arises when spot rates fall below the operating breakeven point - the level at which OPEX and debt service are not covered by revenue.
For an Aframax with OPEX of $11,000/day and debt service of ~$6,900/day (based on our model loan), the cash flow breakeven is approximately $18,000-20,000 per day. During periods of deep market downturn, spot rates have fallen below this level - and vessels have operated at an operating loss.
This is precisely why a time charter at a fixed rate for 2-3 years is not conservatism. It is risk management. By locking in a rate above breakeven for the charter period, the manager shields the investor from market volatility during that time.
Counterparty Risk: The Charterer Does Not Pay
A time charter is a contract. And any contract carries the risk of non-performance by the other party. Charterer default is a rare but real event. Particularly during periods of market stress, when highly leveraged companies begin to experience liquidity problems.
The consequences of charterer default for the waterfall structure:
- immediate cessation of charter receipts;
- the need to urgently redeploy the vessel in the spot market or find a new charter;
- possible breach of bank covenants due to cash flow shortfall;
- legal costs in pursuing recovery of the debt.
This is why, when selecting a charterer, a professional manager conducts a full credit analysis of the counterparty - rather than relying on reputation and company size alone.
The waterfall is not a guaranteed mechanism. It is a structure that works exactly as well as each of its levels is professionally managed. And as honestly as the manager explains to the investor what exactly can go wrong.
One thing remains. To bring it all together.
Regulatory Impact: IMO Changes the Rules
The International Maritime Organization (IMO) has been steadily tightening environmental requirements for fleets. Two key instruments that are already affecting vessel economics:
- EEXI (Energy Efficiency Existing Ship Index) - a mandatory energy efficiency rating for existing vessels. Ships that do not meet the standard are required to carry out technical modifications or limit their operating speed;
- CII (Carbon Intensity Indicator) - an annual operational rating from A to E. Vessels rated D or E for three consecutive years are required to develop a corrective action plan. A poor rating directly affects a vessel's attractiveness to first-class charterers.
For the investor, this means additional unplanned CAPEX, reduced charterability for vessels with poor ratings, and potential downward pressure on rates at recertification. Vessels purchased without accounting for the regulatory profile can deliver an unpleasant surprise within 2-3 years.
Sanctions Risk and the "Gray Fleet"
A separate reality of recent years is the sanctions pressure on part of the global tanker fleet and the emergence of the so-called "gray" or "shadow" fleet. Vessels carrying Russian, Iranian, or Venezuelan oil in circumvention of Western restrictions operate outside the regulated market - without Western insurance, without first-tier classification societies, without transparent AIS tracking.
For investors in the legitimate fleet, this creates two types of pressure:
- Price pressure - the "gray" fleet artificially increases tonnage on certain routes, which weighs on spot rates;
- Compliance risk - unintentional interaction with sanctioned counterparties through a sub-chartering chain can result in breaches of OFAC or EU sanctions requirements.
A professional manager conducts continuous sanctions screening of counterparties, routes, and cargoes. This is not bureaucracy. It is protection for the entire investment structure from regulatory collapse.
The Complete Risk Map
| Risk | Waterfall Level Affected | Mitigation Tool |
|---|---|---|
| Off-hire / emergency downtime | Revenue + OPEX simultaneously | Reserves, technical management, insurance |
| Rates falling below breakeven | Entire waterfall | Fixed time charter, fleet diversification |
| Charterer default | Revenue in full | Credit analysis, counterparty diversification |
| IMO regulatory requirements | CAPEX reserve, charterability | Purchasing younger tonnage, environmental audit |
| Sanctions risk | Entire structure | Continuous screening, clean counterparties |
| Bank covenant breach | Investor distribution | DSCR buffer, operating reserve |
Invest in a Vessel - Invest in a Waterfall
Let us return to where we began.
An Aframax-class tanker is sailing from Rotterdam to Houston. On board - 80,000 tons of crude oil. The charterer has transferred a time charter payment. The investor opens their account statement. But now they know what happens between these two points.
They know that the flow first passes through OPEX - the daily vessel maintenance machine that runs seven days a week and takes no interest in the state of the market. They know the bank stands next - with its covenants, DSCR requirements, and the right to freeze distributions at any moment the metrics deteriorate. They know that reserves are not losses, but the structural engineering that protects the whole arrangement. They know how manager compensation is structured and why the hurdle rate is not a formality, but a mechanism of trust.
And they know that the number that ultimately arrives in their account is neither a coincidence nor the market's generosity. It is the result of every level of the waterfall working correctly. Transparent, sequential, professionally constructed.
What Separates a Good Structure from a Bad One
There are many waterfalls in the market. But not all of them are built the same way. We recommend asking the following questions when evaluating any maritime investment structure:
- What is the level of fixed costs (OPEX + debt service) relative to charter revenue at current rates - and at rates 30% lower?
- Are reserves for drydocking and CAPEX in place - and how do they compare to the historical cost of equivalent work?
- How is manager compensation structured - is there a hurdle rate, a high watermark, and a transparent carried interest calculation methodology?
- What is the creditworthiness of the charterer - and is there counterparty diversification?
- What is the vessel's regulatory profile - does it comply with current CII and EEXI requirements without additional CAPEX?
- How transparent is the reporting - does the investor receive real data on each level of the waterfall, and not just the final distribution figure?
The answers to these questions are what distinguish a professionally structured maritime investment from a polished presentation promising high returns.
The Waterfall as a Management Philosophy
Overhorn Swiss AG builds maritime asset management as a waterfall - with a clear order of priorities, transparent reporting at every level, and institutional governance that does not depend on market sentiment. The Swiss approach to maritime investment is not a geographical brand. It is precision, discipline, and full visibility for the investor into what is happening with their capital at every ledge of the cascade.
Because the maritime market is cyclical by nature. Rates rise and fall. Vessels age and appreciate. Regulators tighten requirements. Geopolitics interferes with routes. All of this is a given, not an exception.
But a waterfall built correctly works in any weather. Slower in a storm - faster in calm. The key is that it works. And that the investor understands why.
Make no mistake: the devil is in every level of the waterfall. And so is the professional.


