
 En
En  De
De


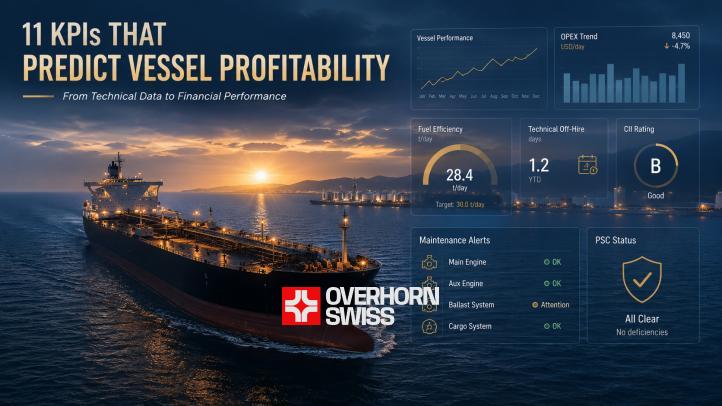
Two identical tankers. The same route. The same freight market. Yet the profit - is different. Sometimes very different.
This is not a paradox or a coincidence. The difference almost always lies not in the freight rate or the captain's luck. It hides in the daily technical decisions that are made - or not made - ashore. In how the asset is managed between voyages. In what happens to the vessel while it is underway.
A technical manager in shipping is not the "person with a wrench." They are, in essence, a financial controller of an asset worth tens of millions of dollars. And a good technical manager always has one thing: a scorecard.
A vessel doesn't sink all at once. Its maintenance costs quietly creep up - until someone finally notices the numbers.
What Is a Scorecard and Why Does a Shipowner Need One
A scorecard is not an Excel table for a quarterly report. It is a living "instrument panel" of the asset, updated in real time, that answers one simple question: is the vessel performing as it should - or not?
The analogy is straightforward. A car has a speedometer, engine temperature gauge, and oil level indicator. You don't wait for the engine to start smoking - you watch the instruments. The logic for a vessel is the same. The only difference is that every "needle" here is measured in money.
Why exactly 11 indicators? Not 5 and not 50. Because this set covers three critical risk zones:
- Technical zone - equipment condition, planned and unplanned maintenance, drydock work
- Operational zone - vessel uptime, inspections, crew quality and stability
- Regulatory and ESG zone - compliance with IMO requirements, fuel efficiency, onboard safety
It is important to understand the difference between two types of KPIs. Leading indicators warn of a problem before it occurs. Lagging indicators record what has already happened. A professional scorecard uses both types - but the emphasis is always on leading ones. Because reacting to a loss after the fact is expensive. Preventing it is significantly cheaper.
A - Money That Disappears Quietly: OPEX Metrics
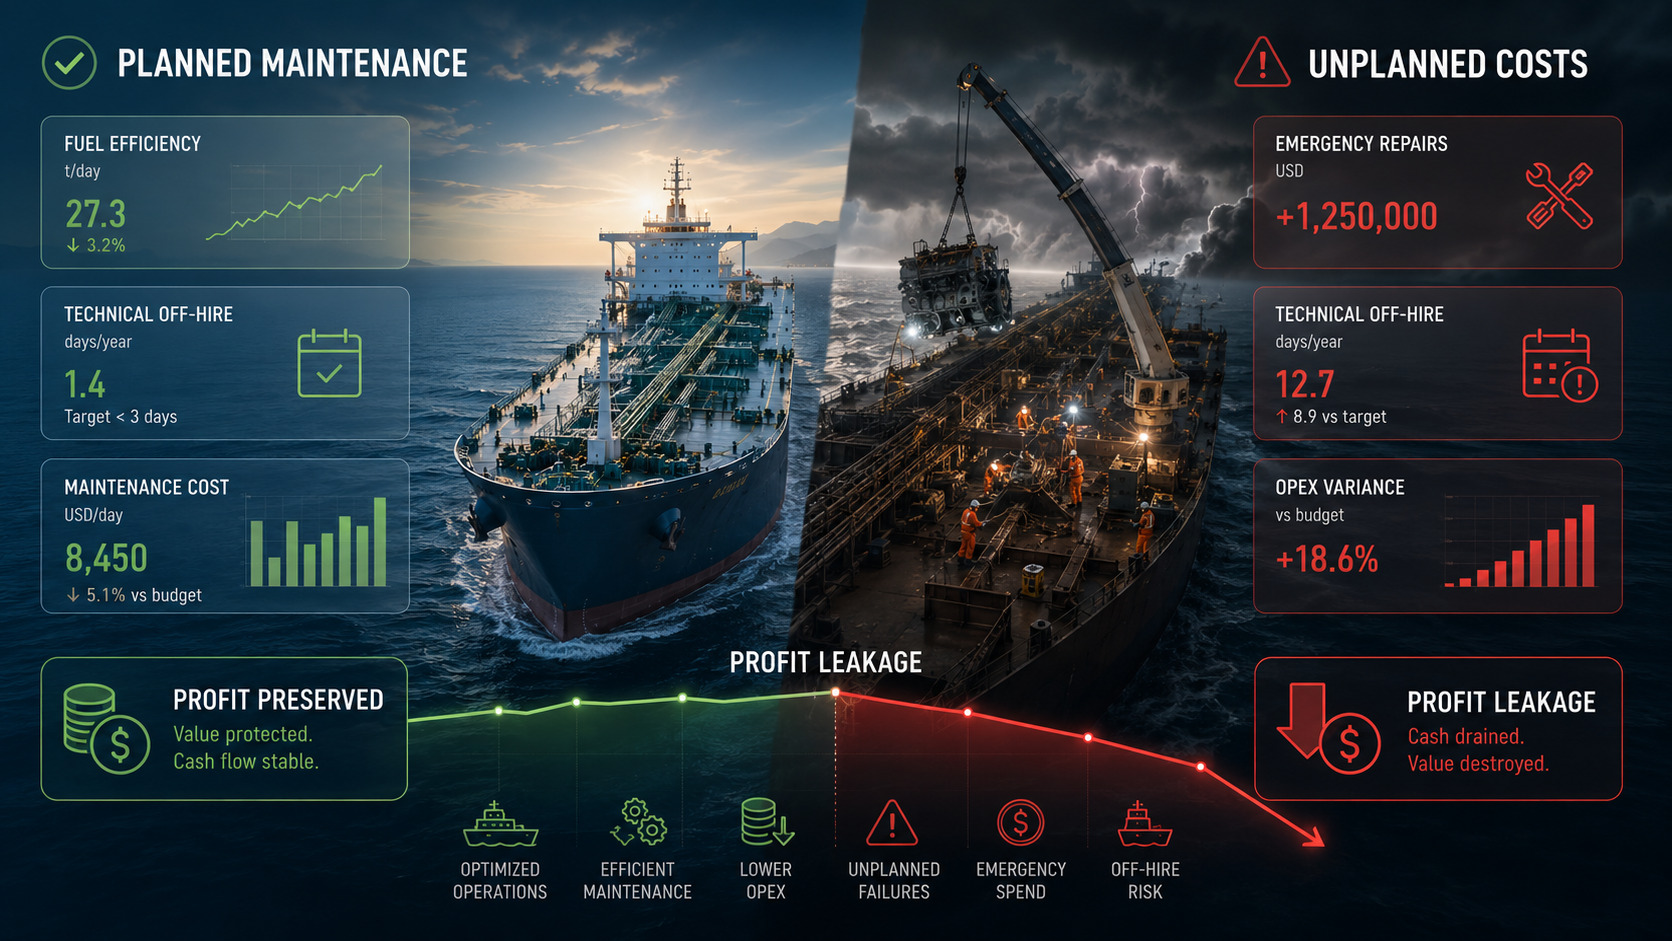
These are the indicators that shipowners least often track over time - and that most frequently become the source of unpleasant surprises when reconciling the budget.
Daily Running Cost vs Budget - daily OPEX against the budget
- What it measures: actual daily operating costs compared to the approved budget
- Why it matters: a deviation of more than 5% over a quarter is the first signal of losing cost control
- Link to profitability: every extra $100 per day amounts to $36,500 per year per vessel. For a fleet of five vessels - that's $182,500 that nobody planned for
Planned vs Unplanned Maintenance Ratio - planned and unplanned repairs
- What it measures: the share of unplanned repairs in the total volume of maintenance work over a period
- Why it matters: unplanned repair costs on average 3-5 times more than planned - factoring in urgency, spare parts logistics, and associated downtime
- Link to profitability: unplanned repair almost always means unplanned off-hire, which is a direct loss of freight revenue
Drydock Cost Variance - deviation from the drydocking budget
- What it measures: how much the actual drydocking costs differ from the approved estimate
- Why it matters: drydocking is one of the largest CAPEX items over the vessel's lifecycle. Cost overruns here can wipe out profits for several quarters at a time
- Link to profitability: budget discipline during drydocking means predictable cash flow for the owner and a strong argument for the bank financing the asset
B - A Vessel Must Work, Not Stand Idle: Operational Metrics
A tanker idle is not a neutral event. It is money not earned. Every hour of off-hire has a specific cost, and the purpose of operational KPIs is to keep that cost as close to zero as possible.
Technical Off-Hire Rate - percentage of technical downtime
- What it measures: the share of time during which the vessel is not earning freight due to a technical failure
- Why it matters: one day of off-hire on an Aframax tanker is $15,000-$25,000 in lost revenue. Not a loss - lost revenue that can never be recovered
- Link to profitability: direct. This is the most "money-sensitive" KPI in the entire scorecard. Zero technical off-hire is a sign of truly excellent technical management
Port State Control Deficiency Rate - findings during port inspections
- What it measures: the average number of findings during Port State Control (PSC) inspections per vessel per period
- Why it matters: a high figure is a direct path to vessel detention in port - which means forced off-hire plus reputational damage that can drag on for months
- Link to profitability: even a 48-hour detention costs more than it appears at first glance: fines, cargo delays, charterer claims, and rising insurance premiums
Vetting Acceptance Rate (SIRE 2.0) - vetting inspection success rate
- What it measures: the share of successfully passed vetting inspections by major oil majors - BP, Shell, TotalEnergies, Chevron, and others
- Why it matters: without vetting clearance, a tanker is physically barred from the terminals of these companies. This is not a recommendation - it is a mandatory condition of operation
- Link to profitability: a low rating narrows the pool of available charters and forces the vessel to work with less attractive shippers at lower freight rates
Crew Retention Rate - retention of key officers
- What it measures: the share of key officers (master, chief engineer, chief officer) renewing their contract with the management company
- Why it matters: replacing an experienced master is not just a recruitment cost. It is the adaptation period of a new commander to the vessel, during which risks are objectively higher
- Link to profitability: high officer turnover statistically correlates with an increase in incidents, PSC findings, and insurance events
C - The Regulator Is Watching. And Fining: Compliance and ESG Metrics
Since 2023, regulatory pressure on shipping has increased sharply. The IMO introduced mandatory Carbon Intensity Indicator ratings; the European Union included vessels in the Emissions Trading System (EU ETS). Ignoring this zone of KPIs means accumulating hidden financial risks that will sooner or later become very visible.
CII Rating - Carbon Intensity Indicator
- What it measures: the carbon intensity of vessel operations on an A-E scale in accordance with IMO requirements (mandatory since 2023)
- Why it matters: a rating of D or E requires the owner to develop a corrective action plan. In the near term - direct operational restrictions
- Link to profitability: vessels rated A/B trade at a premium in the S&P market. Vessels rated D/E - at a noticeable discount. The difference in asset value is already measurable in millions of dollars today
Fuel Consumption vs Performance Curve - actual fuel consumption against the design curve
- What it measures: the deviation of actual bunker consumption from the vessel's design specifications at a given speed and draft
- Why it matters: a 2-3% fuel overconsumption on a large tanker means $400,000-$600,000 in additional annual costs that were not budgeted anywhere
- Link to profitability: on a voyage charter, fuel is the shipowner's expense. Every percentage saved goes directly to the margin - and bunker is today one of the largest variable costs in shipping
Near-Miss & Incident Frequency Rate - frequency of abnormal events
- What it measures: the number of recorded abnormal events and near-misses onboard during the reporting period
- Why it matters: a near-miss is not "a lucky escape." It is the system sending an alarm signal that, this time, was not triggered. Next time may not be so fortunate
- Link to profitability: every serious incident leads to higher P&I Club insurance premiums, potential cargo owner claims, and reputational losses that are hard to quantify - but very easy to feel
Condition Monitoring Score - main engine condition
- What it measures: the technical condition of the main engine based on monitoring data: vibration, exhaust gas temperature, lube oil analysis
- Why it matters: the main engine accounts for 40-60% of all technical costs over the vessel's lifecycle. It is the most expensive component onboard
- Link to profitability: predictive maintenance based on monitoring data dramatically reduces the likelihood of unplanned off-hire - and unplanned off-hire is the single greatest enemy of any shipowner's profitability
How These Indicators Work Together
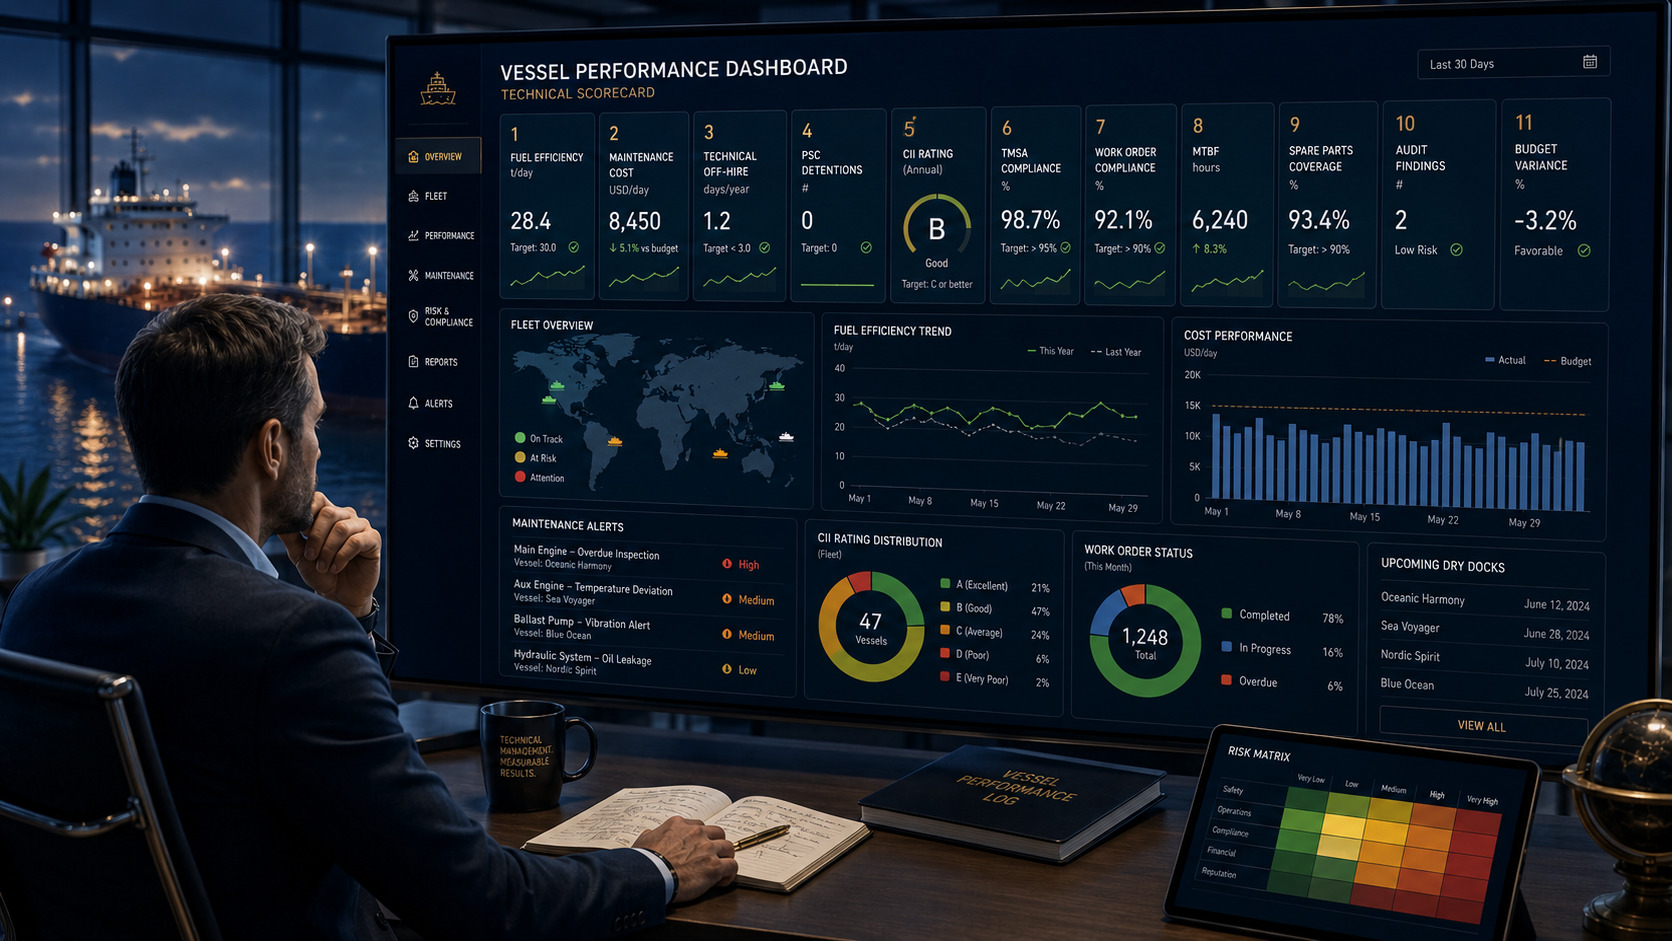
A single KPI in isolation says little. The scorecard works as a system - and that is its core value.
Here is a typical chain that a professional technical manager sees long before it turns into a financial loss:
A good scorecard is an early warning system. A poor one is an obituary of losses that have already occurred.
That is precisely why at Overhorn Swiss AG we build the management of every vessel around a single data platform where all key indicators are visible in real time. The shore team receives a signal before the problem becomes an incident. The shipowner sees numbers - not a retrospective report.
What This Means for the Shipowner and Investor
The scorecard is not an internal tool of the technical manager. It is a document that changes the conversation between the asset owner and everyone working with that asset.
| Situation | How the scorecard changes the decision |
|---|---|
| Vessel purchase (S&P transaction) | Historical data across 11 KPIs reveals the true condition of the asset more accurately than any survey. You see not the condition at the time of inspection - you see the management pattern over years |
| Vessel financing | Banks and leasing companies increasingly request KPI reporting as part of the credit file. A transparent scorecard is a compelling argument in negotiations over financing terms |
| Management company evaluation | The scorecard removes subjectivity. Either the indicators are in order - or they are not. It is an honest conversation without embellishment or vague generalities |
| Asset sale | A vessel with verified CII, off-hire, and PSC history data sells faster and at a higher price. Transparency is a real premium on the asset value |
An investor who sees their vessel's scorecard in real time is an investor who sleeps soundly. Not because everything is perfect. But because they know: if something goes wrong - they will be the first to find out.
Technical Management Is an Investment, Not an Expense
Professional vessel management is often perceived as a service line item in the budget. Something that can be cut if needed. In reality, it is exactly the opposite.
Competent technical management with a transparent scorecard means:
- Predictable OPEX instead of chaotic cost overruns and emergency repairs
- Minimal off-hire and maximum asset utilization throughout the year
- Compliance with regulatory requirements without fines, detentions, or corrective action plans
- Higher asset value at the point of sale - backed by data, not words
- Less stress for the owner and greater confidence in every line of the report
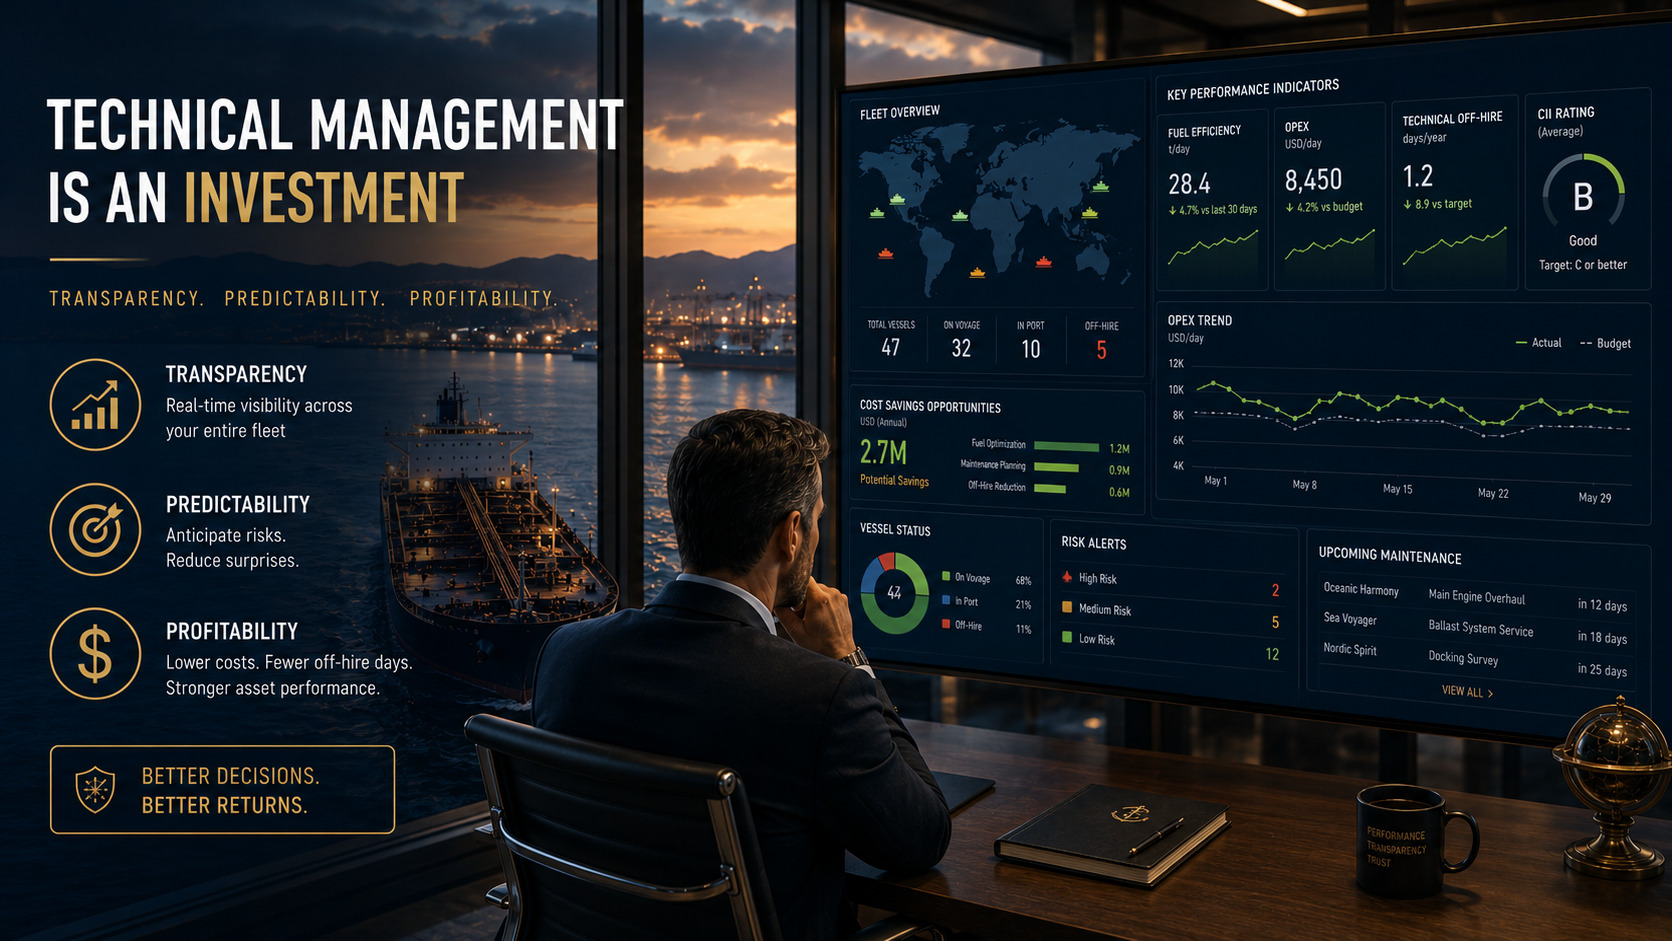
A vessel is an asset that requires constant professional attention. The scorecard is the way to ensure that attention is directed precisely where it is needed most right now.
Want to See What Your Vessel's Scorecard Looks Like?
We are ready to provide an expert consultation and show how Overhorn Swiss AG builds transparent fleet management - with numbers and accountability for every line of the report.


