
 En
En  De
De


The shipping market is not chaotic. It is cyclical - and that cyclicality has a very specific language. You simply need to learn how to read it.
Everyone who has worked in shipping long enough knows the same story. The market rises, freight rates break records, new players enter at the peak of euphoria - and that is precisely the moment the cycle turns. Those who entered at the top exit in panic. Those who panicked out at the bottom miss the recovery.
The paradox is that the data has always been there. The problem is not its absence. The problem is that most people look at the wrong indicators, or look at the right ones - but in isolation, without understanding how they work together.
If you manage a fleet, are considering investments in maritime assets, or make S&P decisions - this article is for you. We will examine five indicators that have repeatedly signaled major market reversals: in 2008, in 2015, in 2020-22. And we will show how to read them together as a single system.
Why the Shipping Cycle Is Not a Natural Disaster
The first thing to understand: the tanker market is cyclical by structure, not by chance. At its core lies a fundamental imbalance between the speed at which tonnage demand changes and the speed at which supply responds.
Demand for crude oil and petroleum product transportation can shift relatively quickly - driven by geopolitics, seasonality, and commodity prices. But the delivery of new tonnage always takes 2-3 years from order placement to launch. It is precisely this lag that creates the cyclical amplitude we observe time and again.
Why is this cycle more severe in tankers than in bulk carriers or containers? Several reasons:
- Tanker tonnage is less interchangeable - a VLCC cannot replace a product tanker
- The sanctions environment of recent years has added structural volatility to cargo flow distribution
- Major oil companies are shifting from long-term time charters to spot contracts - making the market more sensitive to short-term shocks
The key takeaway to remember: the market always telegraphs in advance. The only question is whether you know how to receive the signal.
Three major peaks since 2000 that we will reference:
- 2007-2008 - all-time high freight rates, VLCC spot above $200,000/day
- 2014-2015 - a short-term supercycle driven by falling oil prices and rising cargo volumes
- 2019-2022 - the COVID anomaly plus the sanctions supercycle following February 2022
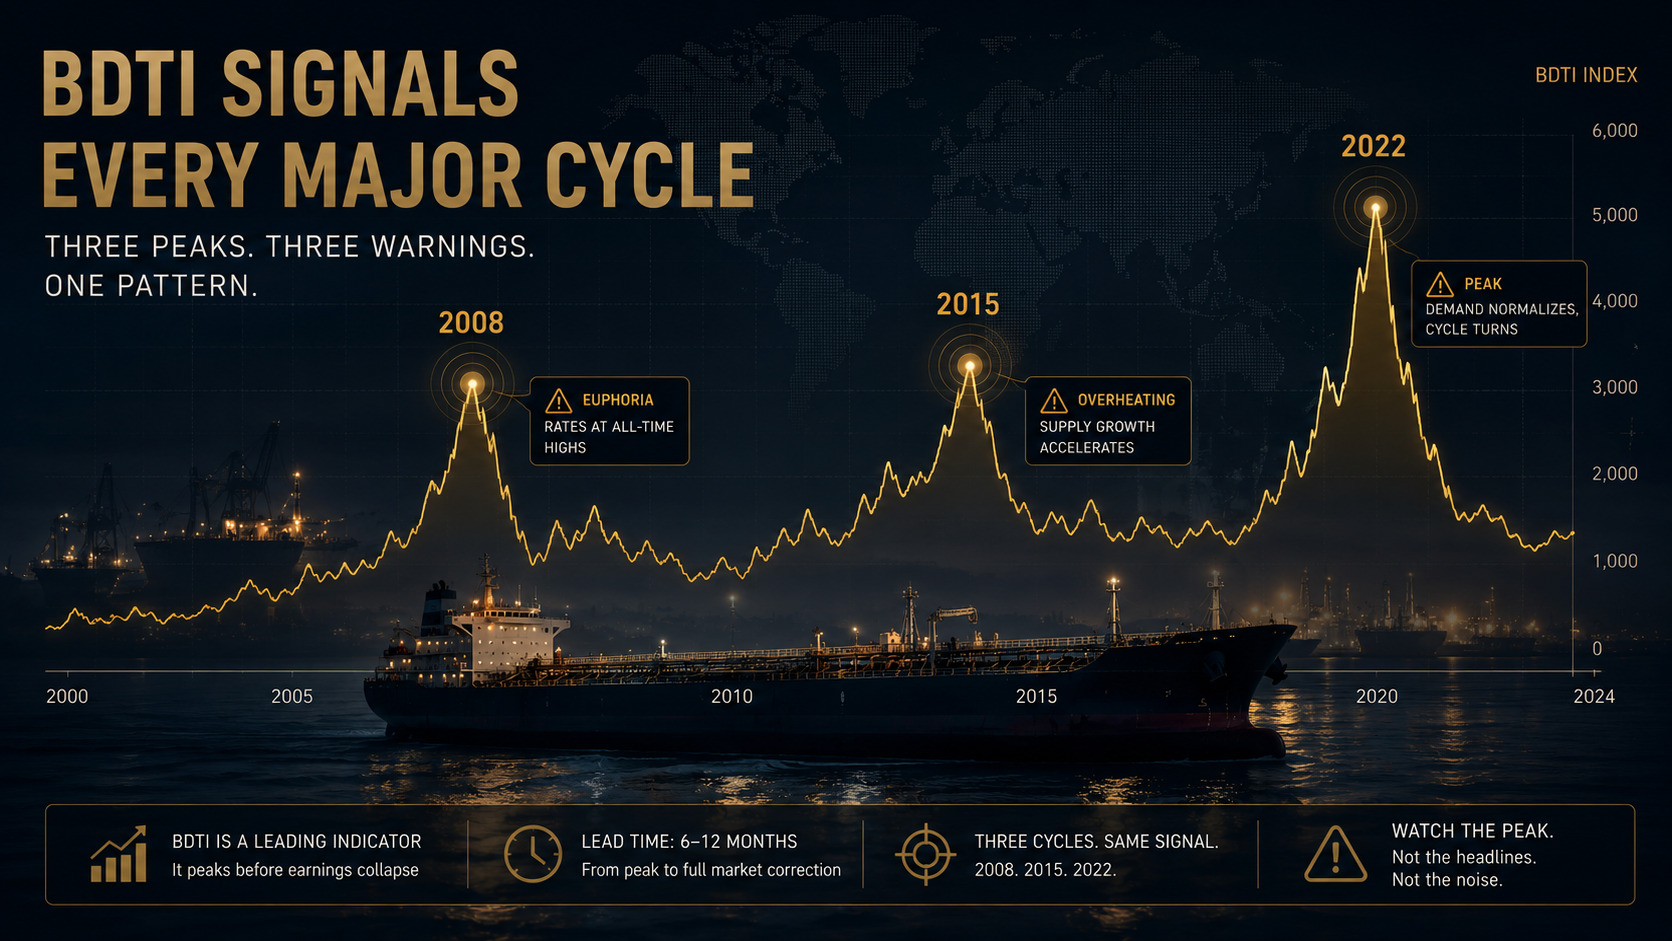
Baltic Dirty Tanker Index (BDTI): The Market's Pulse That Doesn't Lie
INDICATOR 01
The BDTI is a composite index of freight rates for crude oil transportation, published by the Baltic Exchange. But treating it as simply "the freight price" is a mistake. The BDTI is a real-time barometer of the current supply-demand balance in the tonnage market.
How to read the BDTI correctly:
- The absolute value matters, but is less informative than the trend and the angle of ascent
- A sustained rise over 3-6 months is a stronger signal than a sharp spike over 2-3 weeks
- Volatility within the trend increases closer to the peak - this signals growing instability
In 2007-2008, the BDTI rose from ~800 to ~2,300 points over 14 months. Those who read this rise as a structural trend rather than a speculative spike managed to lock in assets at peak prices or secure time charters on favorable terms before the 2009 reversal. Those who entered S&P deals at the 2,000+ point level acquired assets with a liability at the very moment rates collapsed by more than half over the following 18 months.
The beginner's trap is to interpret a sharp BDTI spike as a buy signal. In reality, it is already a signal for caution. A sustained BDTI rise from low levels (600-900 points) with growing momentum - that is the real window of opportunity.
"The BDTI is a body temperature reading. To make a diagnosis, you need a blood test."
Orderbook-to-Fleet Ratio: How Much Tonnage Is Coming to Market - and When
INDICATOR 02
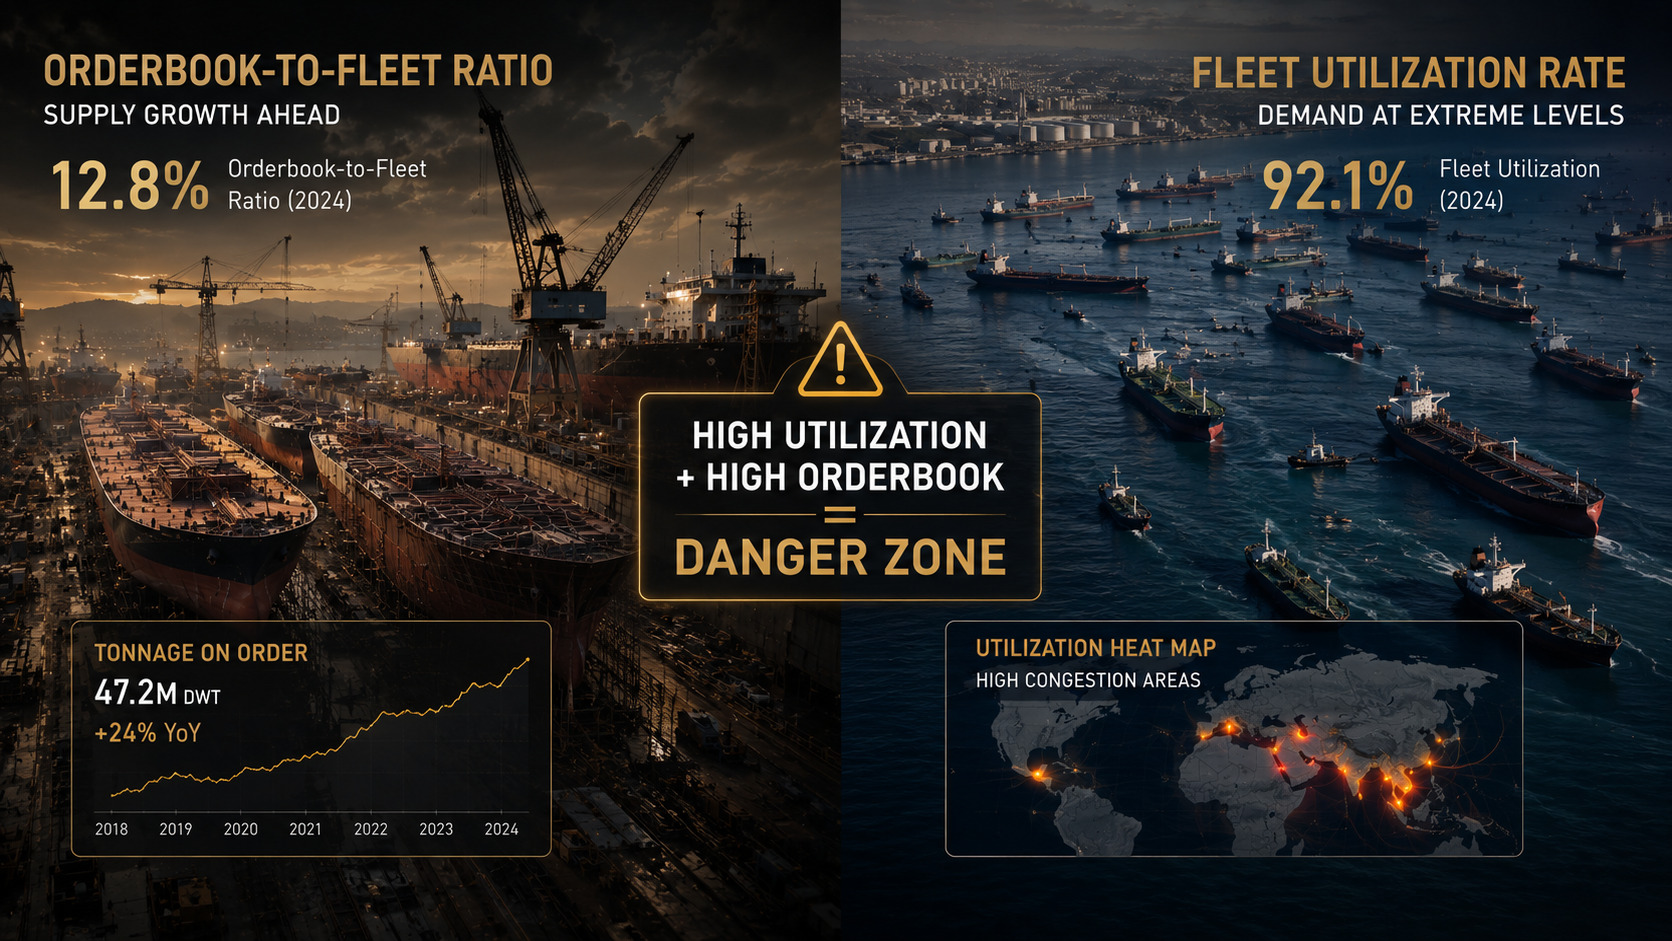
One of the most powerful leading indicators in shipping is the ratio of the newbuilding orderbook to the existing fleet, expressed as a percentage of total DWT. Its strength lies in its forward-looking nature: today's orderbook is tomorrow's tonnage supply.
Why the 2-3 year lag matters so much:
- A vessel ordered today will enter the market 2-3 years from now
- By that point, market conditions may have changed dramatically
- This is precisely why the orderbook is an indicator of future pressure on rates, not current pressure
The explosive growth in orders during 2006-2008 led to mass vessel deliveries in 2010-2012 - right in the middle of the post-crisis demand slump. Those who knew how to read the orderbook back in 2007 could see that the market was building in oversupply that would inevitably weigh on rates. That analysis could have prevented asset purchases at peak prices.
Practical benchmarks:
- Orderbook above 20-25% of fleet - the market is overheating; new supply will pressure future rates
- Orderbook below 8-10% of fleet - supply is structurally constrained; rates have room to grow
- Zero or minimal orderbook combined with an aging fleet - historically one of the strongest entry signals
Data sources: Clarkson's Research, VesselsValue, Clarksons Shipping Intelligence Network
TCE vs. OPEX Spread: When a Vessel Starts Earning - and When It Stops
INDICATOR 03
TCE (Time Charter Equivalent) is the actual earnings of a vessel after deducting voyage costs, expressed in dollars per day. It is the TCE, not the gross rate, that shows what the asset is truly generating for the owner.
OPEX is the daily operating cost of a vessel. It includes:
- Crew costs - typically 35-45% of OPEX
- Maintenance and repair
- Insurance (P&I, H&M)
- Stores, spares, and lube oils
- Management fee
The spread between TCE and OPEX is an indicator of the cycle's true health. When this spread is positive and wide, the market is working. When it narrows - stress begins. When TCE falls below OPEX - the owner is operating at a loss.
In 2014-2016, VLCC TCE on certain routes fell below breakeven. Owners without financial reserves and carrying heavy debt found themselves in a critical position: assets were not covering operating costs, and banks were demanding additional collateral. That was when the S&P market received a wave of distressed sales at rock-bottom prices - the best opportunities for buyers with liquidity.
Practical benchmarks for cycle analysis:
- TCE/OPEX above 2.5x - market in a phase of confident growth
- TCE/OPEX 1.5-2.5x - normal operating environment
- TCE/OPEX below 1.5x - caution signal; the cycle is contracting
- TCE/OPEX below 1.0x - market under stress; buy-side opportunities are emerging
This spread determines whether an asset will generate stable cash flow or consume reserves. When evaluating investments in maritime assets, TCE/OPEX analysis is a mandatory element of due diligence.
Fleet Utilization Rate: The Last Signal Before a Reversal
INDICATOR 04
Fleet utilization is the share of actively deployed tonnage relative to the total tonnage available in the market. It is calculated as the ratio of active fleet to total fleet, excluding vessels in layup, undergoing repairs, or on ballast passages.
At first glance, high utilization seems positive. And it genuinely is. But there is a nuance that catches most newcomers off guard.
Utilization above 90% is not "all is well" - it is "time to prepare." A market loaded above its physical limit cannot grow indefinitely. Any additional tonnage supply - new deliveries, vessels returning from layup, route reallocation - causes rates to collapse disproportionately fast.
In 2007-2008, tanker fleet utilization was approaching 92-93% - precisely when the BDTI hit all-time highs and VLCC spot rates exceeded $200,000/day. At that moment, most institutional and private investors were only beginning to take the sector seriously. Those who understood what such utilization levels meant in combination with a growing orderbook were exiting - not entering.
The relationship between utilization and the orderbook is critically important:
- High utilization + low orderbook - a rare and valuable combination: the market is fully loaded and new supply is scarce
- High utilization + high orderbook - the final phase of the cycle: rates are at their peak, a reversal is inevitable
- Low utilization + low orderbook - a potential entry point for a patient investor
Secondhand Asset Prices vs. Newbuilding Parity: Where the Market Sees the Future
INDICATOR 05
One of the most underappreciated indicators is the ratio of a secondhand vessel's price (S&P price) to the cost of an equivalent new vessel (newbuilding price, NB parity). This spread directly reflects how the market views the near-term future.
The logic is straightforward:
- If buyers are willing to pay as much or more for a used vessel as for a newbuild - they expect high rates over the next 2-3 years and do not want to wait for delivery
- If a used vessel trades at a 30-40% discount to NB - the market is skeptical, rates are low, and these are historically the best entry points for long-term investors
Case 2020-2021: VLCC secondhand vessels were trading at a 35-40% discount to newbuilding cost. Investors who entered assets during this period earned a double gain: rising S&P prices on the back of the 2022 sanctions supercycle, plus record-breaking freight rates.
Case 2007-2008: S&P prices for certain tanker types exceeded NB parity by 20-30%. The market was paying a premium for immediate access to tonnage. That was precisely when those who understood the significance of this signal were selling assets, locking in maximum value.
For S&P decisions, this indicator is one of the most practical tools for assessing entry and exit timing. Analysis of the S&P/NB parity ratio is central to the asset selection process in Capital Deployment within institutional maritime portfolio management.
Data sources: VesselsValue, Clarksons Shipping Intelligence, Baltic Exchange
The Cycle Phase Matrix: How the Five Indicators Work Together
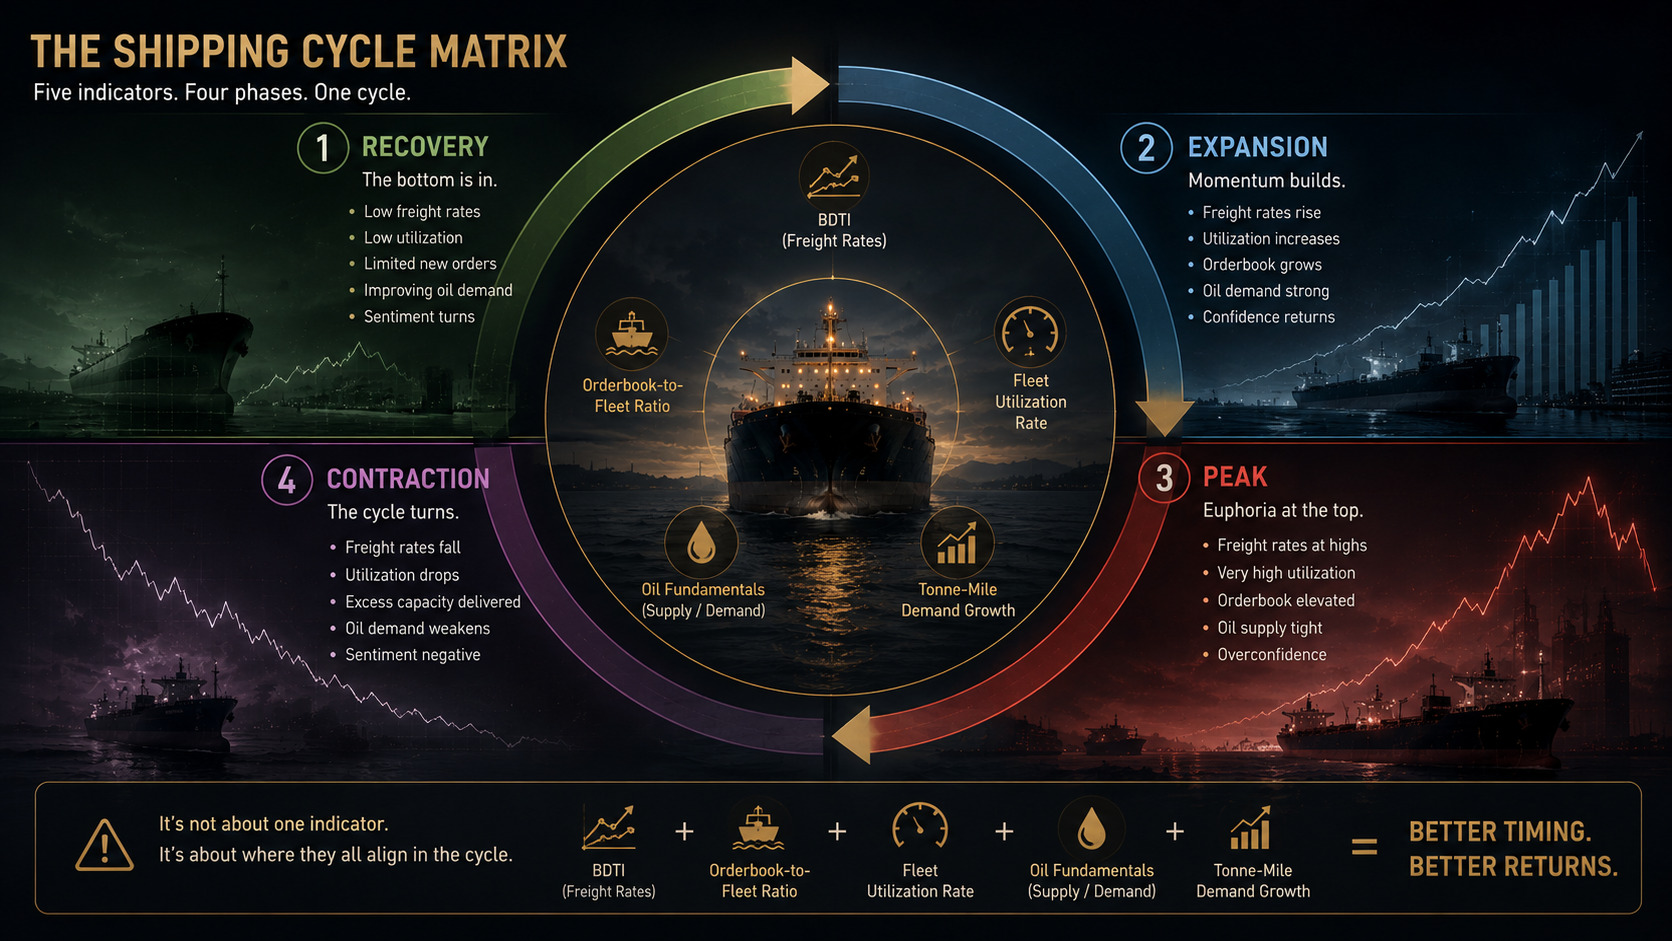
No single indicator works in isolation. The BDTI can rise even when the orderbook is high - and those represent different cycle phases. Utilization can be high with a weak TCE/OPEX spread - if operating costs have spiked sharply. Only when signals converge does real conviction emerge.
Below is a summary matrix showing how all five indicators behave in each of the four phases of the shipping cycle:
| Phase | BDTI | Orderbook / Fleet | TCE / OPEX | Utilization | S&P vs NB |
|---|---|---|---|---|---|
| Recovery | Low, beginning to stabilize | Minimal, < 8-10% | ~1.0-1.5x | 82-86% | 30-40% discount to NB |
| Expansion | Steady growth | Beginning to rise, 10-18% | 1.5-2.5x | 87-90% | 10-20% discount to NB |
| Peak | At its peak, high volatility | High, > 20-25% | > 2.5x | > 90% | At parity or at a premium to NB |
| Contraction | Falling, spikes without trend | Deliveries pressuring the market | Narrowing, < 1.5x | < 85%, layup increasing | Premium giving way to discount |
The key takeaway: the real power of this approach lies in reading all five indicators simultaneously. When Recovery signals align across four out of five metrics - that is not merely a hypothesis. It is a systemic signal worth acting on.
What This Means for Investors and Fleet Managers Today
The shipping market of 2024-2025 presents a complex picture. The sanctions-driven redistribution of cargo flows continues to exert a structural influence on tonnage demand. The orderbook in several segments remains at historically low levels. The age profile of the fleet creates additional supply-side constraints over the medium term.
Reading the current phase correctly requires continuous monitoring of all five indicators in motion - not one-off snapshots. This is precisely where individual investors and fleet managers face an objective challenge: tracking BDTI, the orderbook, TCE/OPEX, utilization, and S&P parity simultaneously, while cross-referencing them against the geopolitical backdrop and regulatory agenda (EU ETS, CII ratings, fleet age restrictions) - is a full-time analytical undertaking.
This is precisely why institutional asset management in the maritime sector exists - to ensure that no signal is missed at the moment when it carries the greatest value.
The market is complex. But it is not mysterious. It has a language. And once you begin to read it systematically, the seemingly chaotic movements of freight rates resolve into a comprehensible, if demanding, score.
Want to analyze the current cycle phase together with the Overhorn Swiss AG team?
We manage capital in the maritime sector with a focus on disciplined asset selection, OPEX optimization, and transparent reporting. If you are considering investments in maritime assets or would like an independent perspective on the current market phase - we are ready to talk.
info@overhorn.ch | +41 79 828 07 07 | Werftestrasse 4, 6005 Luzern, Switzerland
This article is analytical and educational in nature. The historical data and indicators cited do not constitute investment advice. Decisions regarding investments in maritime assets should be made on the basis of comprehensive due diligence with the involvement of professional advisors.


