
 En
En  De
De


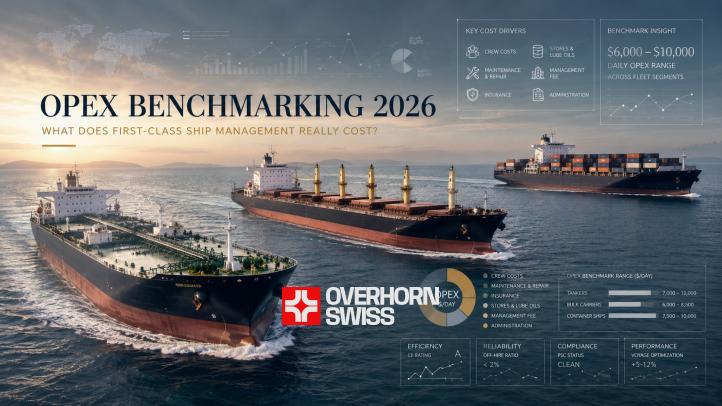
Overhorn Swiss AG | Luzern, Switzerland | 2026
Is $8,500 per day expensive or cheap? Most shipowners know their OPEX figure. But far from all of them understand whether it is a good one. The same amount can be either a sign of excellent management or a symptom of impending disaster - depending on what lies behind it.
The Cost of the Question
When it comes to fleet operating costs, the conversation almost always comes down to a single number - the daily OPEX. A shipowner looks at the report, sees $9,200/day for their Aframax, and thinks: "Last year it was $8,700. Something is going wrong." Or, on the contrary: "$7,100 for a Capesize - we're doing well, we're saving money."
Both reactions may be mistaken. OPEX without context is like a body temperature reading without knowing what is actually wrong. Remember the fundamental rule of benchmarking: the cost structure matters more than the final figure.
The Anatomy of Daily Costs: What Is Included in OPEX
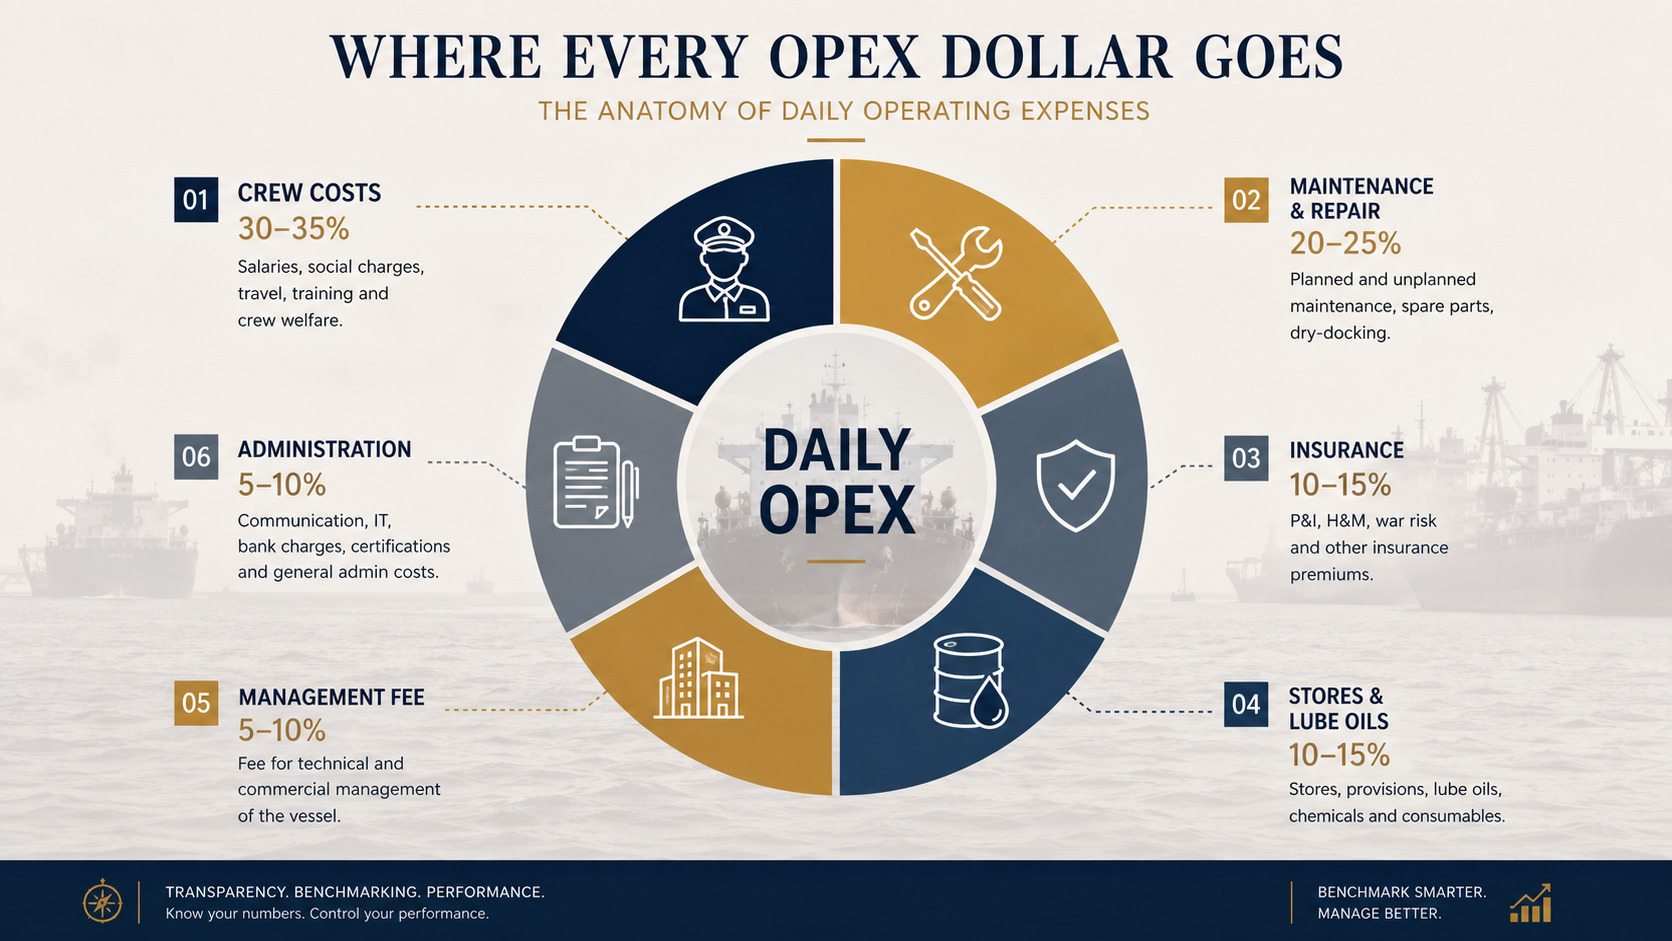
Before comparing figures, we need to make sure we are comparing like with like. The standard structure of vessel OPEX is as follows:
| Cost Item | Share of OPEX | Comment |
|---|---|---|
| Crew costs | 45-50% | Wages, repatriation, medical, training |
| Maintenance & Repair | 15-20% | Planned repairs, spare parts, contractors |
| Insurance | 10-12% | H&M, P&I, War Risk |
| Stores & Lube Oils | 8-10% | Consumables, provisions |
| Management Fee | 6-8% | Ship management company remuneration |
| Other (Admin, surveys, misc) | 5-7% | Classification, communications, audit |
When an operator shows you a low total OPEX, the first question is not "why so cheap?" but "what exactly is being cut?" A reduced crew or a deferred drydock today means off-hire and emergency repairs tomorrow. In our experience, that is exactly what most "unexpected" vessel problems look like.
"First-class" management is not a synonym for the most expensive. It is management in which every dollar of OPEX works to protect the asset and generate income, rather than simply covering minimum obligations.
2026 Benchmarks: Real Figures by Vessel Type
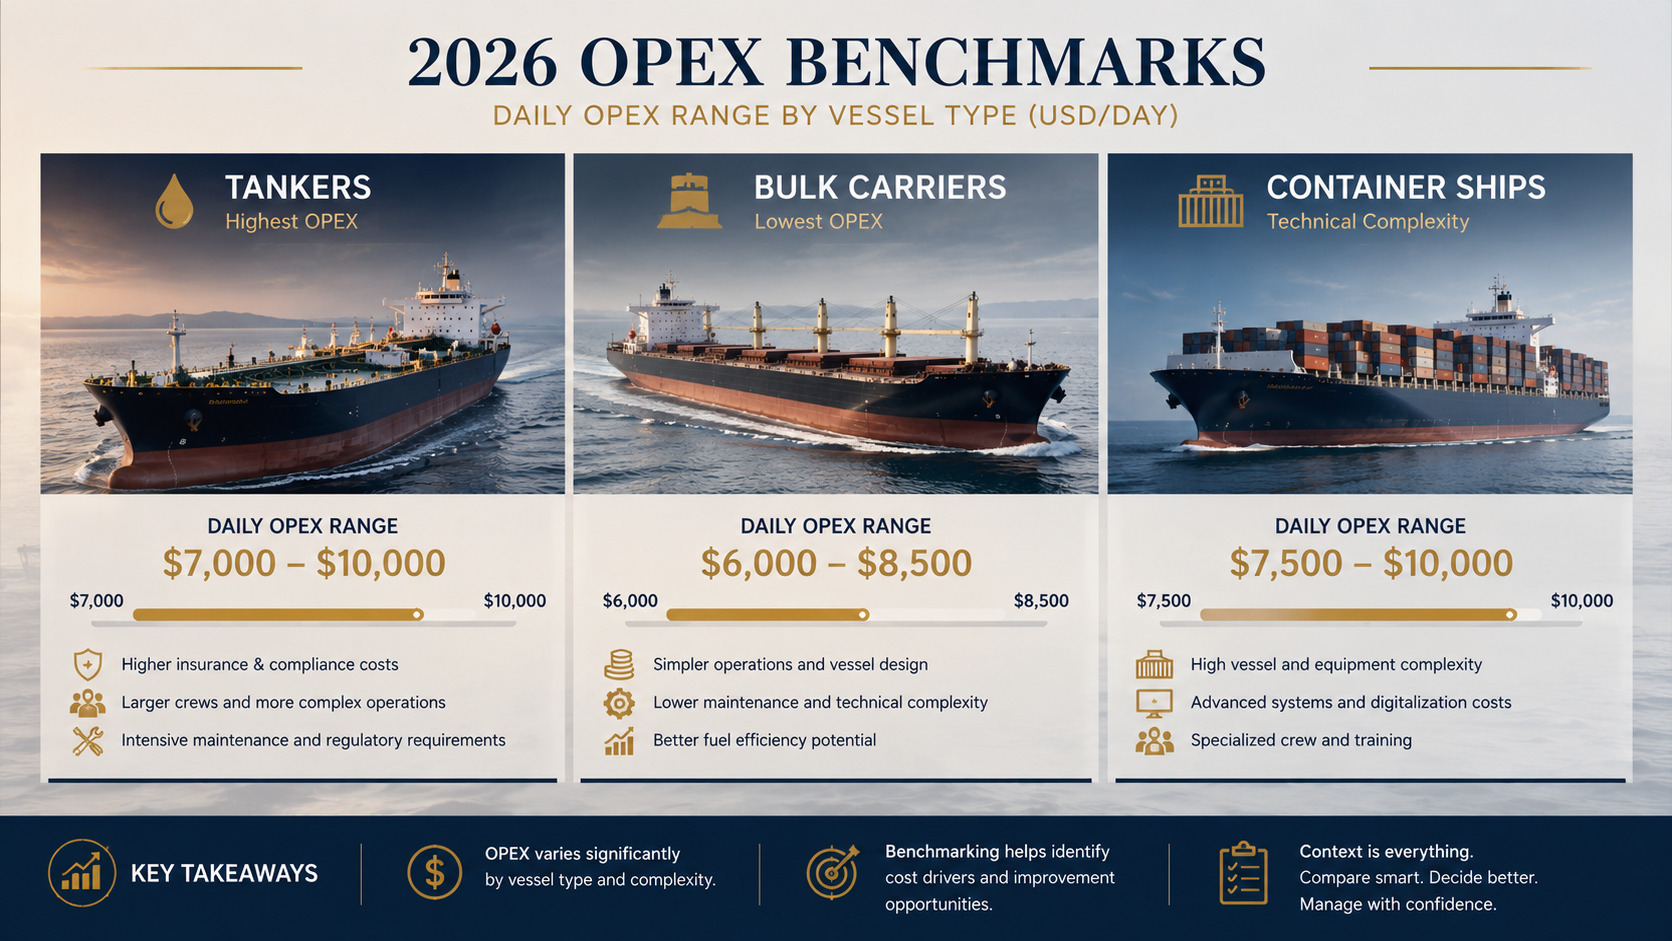
Below are current OPEX ranges for the "first-class" management segment - that is, for vessels that meet the vetting requirements of leading oil majors, have a clean PSC history, and are managed by operators with transparent reporting. The data is based on industry sources: the Drewry Ship Management Annual Report, Moore Stephens (KPMG Maritime), and Clarksons Research.
Tankers
The tanker fleet traditionally carries the highest OPEX of the three vessel types - and for good reason. SIRE 2.0, CDP requirements, specialized crew with dangerous cargo certification, double hull, and complex cargo systems. There is no room for savings on personnel or equipment here - the cost of an error is measured not in repair bills, but in reputational damage and loss of vetting approval.
| Vessel Type | OPEX "Economy" Segment | OPEX "First Class" | Key Driver |
|---|---|---|---|
| VLCC (300,000+ DWT) | $8,200-9,000/day | $9,800-11,500/day | Crew, SIRE compliance, P&I |
| Suezmax (130-200,000 DWT) | $7,500-8,200/day | $8,800-10,200/day | Maintenance, vetting |
| Aframax / LR2 (80-120,000 DWT) | $6,800-7,500/day | $7,900-9,200/day | Crew, class surveys |
| MR Tanker (25-55,000 DWT) | $5,900-6,800/day | $7,000-8,200/day | Stores, multi-product specifics |
Bulk Carriers
The bulk carrier fleet traditionally has the lowest OPEX. The design is simpler, crew costs are lower, and vetting requirements are incomparably less stringent. This is precisely where the main trap lies. It is on bulk carriers that the temptation to "save on maintenance" most often arises - and they also lead in port state control detentions (PSC detentions).
| Vessel Type | OPEX "Economy" Segment | OPEX "First Class" | Key Driver |
|---|---|---|---|
| Capesize (150,000+ DWT) | $6,000-6,800/day | $7,200-8,800/day | Maintenance, drydock cycle |
| Panamax / Kamsarmax (65-85,000 DWT) | $5,200-6,000/day | $6,300-7,500/day | Crew, hatch covers, cargo pumps |
| Supramax / Ultramax (52-65,000 DWT) | $5,000-5,700/day | $6,000-7,200/day | Cranes, class surveys |
| Handysize (15-40,000 DWT) | $4,500-5,200/day | $5,400-6,400/day | Stores, crew |
Container Ships
Container ships are the most technically complex of the three types. Refrigerated containers (reefer units) require constant monitoring and maintenance, equipment becomes obsolete quickly, and crew requirements are significantly higher than for bulk carriers. At the same time, off-hire here is particularly costly - liner schedules are unforgiving of delays.
| Vessel Type | OPEX "Economy" Segment | OPEX "First Class" | Key Driver |
|---|---|---|---|
| Post-Panamax (8,000+ TEU) | $8,000-9,200/day | $10,500-13,000/day | Crew, reefer units, electrical systems |
| Panamax (3,000-8,000 TEU) | $6,800-7,800/day | $8,500-10,200/day | Maintenance, class surveys |
| Feeder (up to 3,000 TEU) | $5,500-6,500/day | $6,800-8,000/day | Crew, port costs |
What Is Driving OPEX Up in 2026
Even if you have been managing a fleet for many years and know your daily vessel cost well - the 2026 benchmarks will require a reassessment of familiar reference points. Several factors are simultaneously pushing OPEX upward from different directions.
- Shortage and cost of qualified crew. After the pandemic, the officer market never fully recovered. The geopolitical restrictions of 2022-2024 effectively removed a significant portion of Ukrainian and Russian seafarers from the open market - two of the largest pools of qualified senior officers. The result: senior officer wages have risen by 12-18% year-on-year, and competition for certified specialists has reached a 15-year high.
- EU ETS and CII compliance. This is no longer the future - it is the present. The European Emissions Trading System has applied to maritime transport since 2024, and the cost of carbon allowances has become a real line in the P&L. The CII rating directly affects a vessel's commercial attractiveness: a vessel rated D or E loses chartering opportunities and resale value. Managing these metrics requires both investment and expertise.
- Rising drydock costs. Shipyards are overloaded, queues have grown longer, and the cost of labour and materials has risen by 20-30% compared to pre-pandemic levels. A well-planned drydock today costs significantly more than three years ago - but a poorly planned one costs even more due to idle time and overtime work.
- Cybersecurity and digital systems. Mandatory cyber audits (ISM Code amendments), PMS platforms, VSAT communications, real-time monitoring systems - all of this has become part of normal OPEX in the first-class segment. Not an option. Not "nice to have." A requirement.
By our estimates, the combined pressure of these four factors has added between $400 and $900/day to the industry-average OPEX, depending on vessel type. Those who have not updated their budget models are already operating at a loss - they just do not know it yet.
Where Operators Lose Money While Thinking They Are Saving It
A conversation about a low management fee always looks attractive during negotiations. However, there are several persistent patterns we observe time and again - patterns that end up costing owners significantly more than they saved.
- Low fee - hidden disbursements. The management company agrees to a minimal fee, then bills everything else as "additional expenses" without prior approval. Transparent P&L is impossible without a fixed and clear fee structure.
- Saving on crew = PSC detention. A port state control detention is not just a fine. It is off-hire, reputational damage, loss of vetting approval from oil majors, and difficulties with future charters. One serious PSC incident wipes out years' worth of crew cost savings.
- Deferred repairs = an emergency bill. Planned maintenance costing $50,000 that "can wait until next quarter" frequently turns into an emergency repair costing $200,000-500,000 - plus several days of off-hire at an inopportune point in the freight cycle.
- The "grey" insurance market. Saving on insurance premiums through clubs of questionable reputation is a classic mistake. Everything looks fine until the first major incident. Afterwards, the owner discovers that the actual coverage does not match what was promised.
- Lack of integration between commercial and technical management. When chartering strategy is decided without taking the vessel's technical condition into account - and vice versa - both sides lose efficiency. TCE falls, costs rise, and coordination between teams consumes time and money.
A cheap ship manager is not a cost-saving measure. It is a deferred bill that always arrives at the most inconvenient moment.
What "First-Class" Management Looks Like in Practice
Let us move from figures to qualitative criteria. The OPEX benchmark is only one side of the assessment. The other is understanding exactly what you are getting for that money.
First-class fleet management in 2026 entails the following:
- Transparent P&L and voyage reporting with no black boxes. Every cost item must be explainable, and every deviation from budget must be commented on before the owner even asks the question.
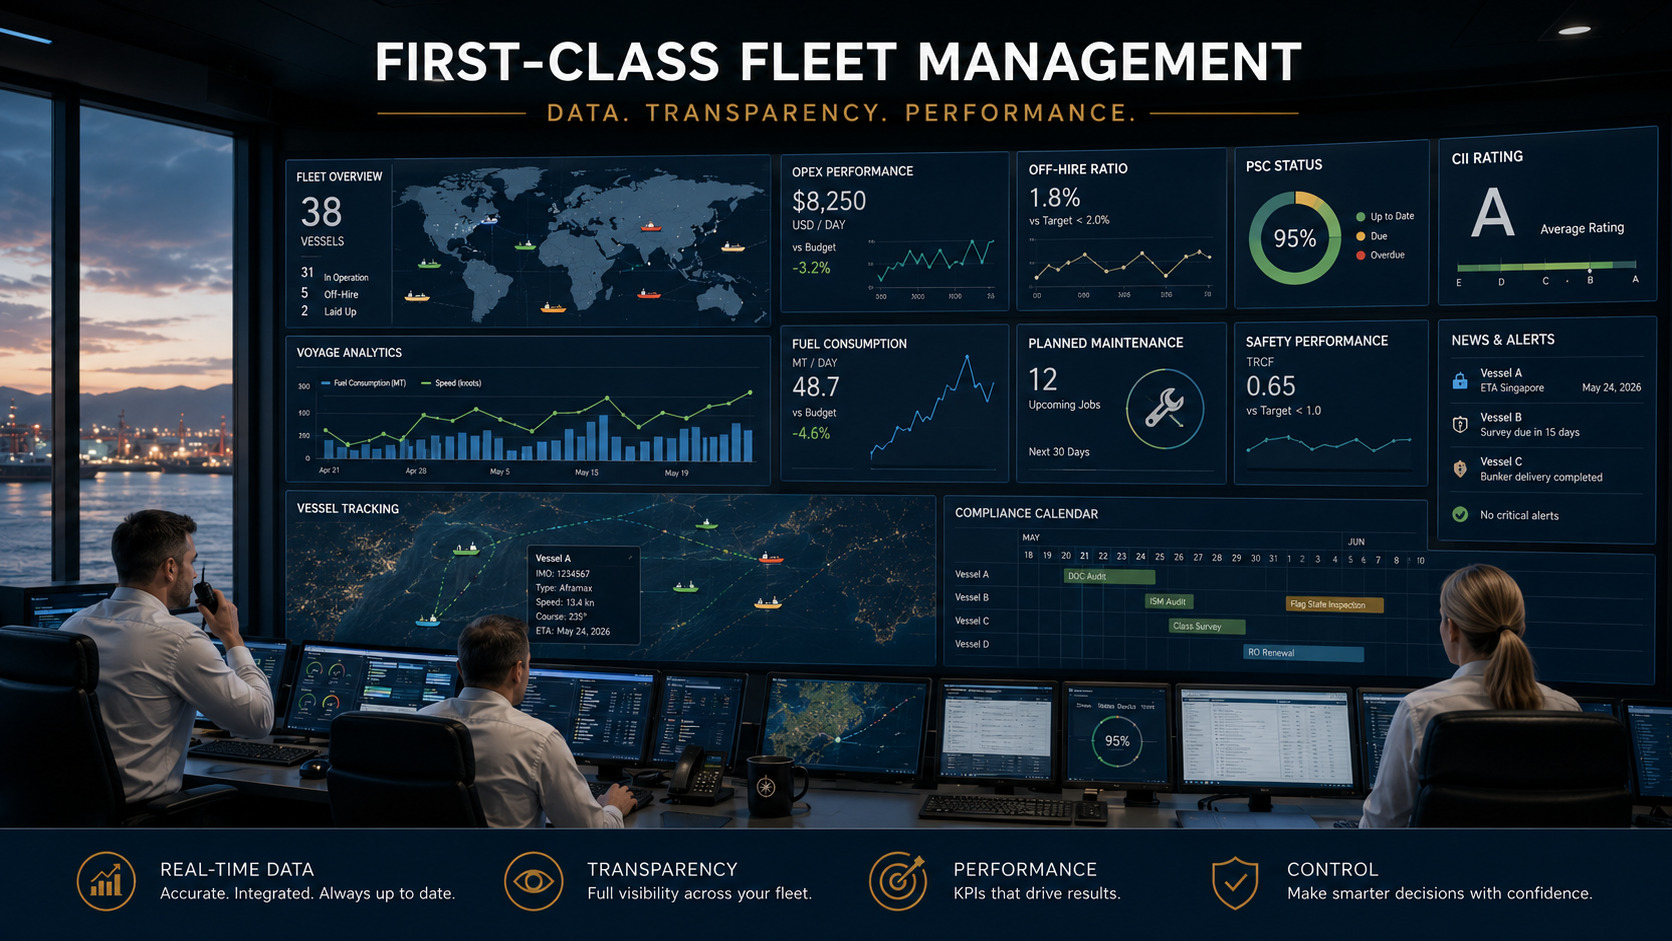
- Real-time KPI monitoring. Off-hire ratio, defect ratio, CII rating, PSC history - these are not a quarterly report, but a live dashboard. Problems must be visible before they become incidents.
- Integration of commercial and technical management. This is a fundamental point. When chartering strategy and technical planning operate under one roof, decisions are made faster, TCE is higher, and unpleasant surprises are fewer. This principle is at the core of Overhorn Swiss AG's approach: the commercial team and the technical department coordinate continuously, rather than exchanging reports once a month.
- Proactive drydock strategy. Not "when the time comes" - but planning 12-18 months ahead, taking into account the freight cycle, shipyard availability, and budget. A good operator knows when it is best to enter a drydock in order to minimize TCE losses.
- Direct access to the freight market. A management company with its own commercial team is not merely a convenience. It is the ability to respond to market movements in real time, select the optimal trades, and avoid losing profitability while waiting on broker negotiations.
Benchmarking Tools: How to Calculate Correctly
If you want to objectively assess where your fleet stands relative to the market, a single OPEX/day figure is not enough. Normalization and the right formula are required.
Key Normalization Parameters
- Flag of the vessel - crew costs differ significantly depending on the flag and flag state requirements.
- Vessel age - OPEX grows non-linearly after 10-12 years: repairs become more frequent, insurance premiums increase, and class requirements grow more demanding.
- Class and last drydock - a vessel before a drydock and after a drydock represent two different OPEX profiles.
- Trade type - a dirty tanker in the Persian Gulf and a product tanker in the Baltic trade carry different costs for the same deadweight.
Main Data Sources
- Drewry Ship Management Annual Report - the most detailed industry benchmark by vessel type and region.
- Moore Stephens / KPMG Maritime OpCost - an annual report with real OPEX data from major operators.
- Clarksons Research - current freight market data for calculating the TCE context.
- Operator's own statistics - where transparent reporting is available, this is the most accurate source for a specific fleet.
A Reasonable Assessment Formula
We recommend evaluating not just OPEX/day, but an expanded metric:
| Component | What It Accounts For |
|---|---|
| OPEX/day (base) | Standard operating expenses |
| + Off-hire cost (annual / 365) | The real cost of idle time due to technical reasons |
| + PSC risk premium | Probabilistic cost of detention x average damage |
| + CII compliance cost | Cost of meeting carbon rating requirements |
| = Real cost of management | The complete picture of operator efficiency |
Red Flags in Reporting
What an investor or shipowner should pay attention to when analysing operator data:
- An off-hire ratio above 1.5% per year without explanation is a sign of systemic technical problems.
- A sharp drop in OPEX without changes to crew composition or the maintenance plan almost always means deferred costs.
- The absence of a breakdown between management fee and disbursements makes it impossible to understand what management actually costs.
- No data on defect ratio and PSC history means the operator either does not keep records or is concealing results.
- CII rating not appearing in reports is unacceptable for a serious operator in 2026.
The Right Question
Remember the question from the beginning of this article: "Is $8,500 per day expensive or cheap?" You now have the tools to answer it yourself. The answer depends not on the amount, but on what lies behind it: what type of vessel, what flag, what age, what quality of management, and - most importantly - what the real expanded cost is, taking into account off-hire, PSC risk, and CII compliance.
The right question is a different one: "How much does poor management cost?" One serious incident, one port detention, one emergency repair at the wrong point in the freight cycle - and years' worth of savings on management fees evaporate in a matter of days.
We recommend reviewing your fleet benchmark at least once a year - and comparing not only the final figures, but also the cost structure, the quality of reporting, and the completeness of KPI data. If your current operator cannot provide this information in a transparent form, that in itself is a red flag.
Overhorn Swiss AG · Werftestrasse 4, 6005 Luzern, Switzerland · info@overhorn.ch · +41 79 828 07 07


