
 En
En  De
De


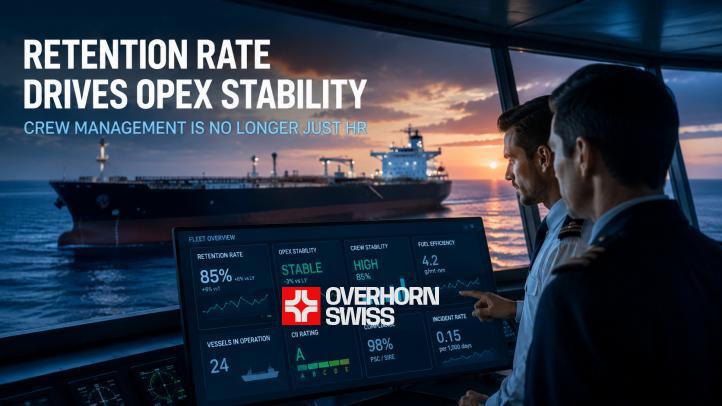
Shipowners scrutinize every line of the budget. Bunkers - under the microscope. Drydocking costs - under the microscope. Insurance rates - likewise. But there is one variable the industry has been undervaluing for years. That variable is crew turnover. Or, more precisely, its mirror image: the Retention Rate.
Most shipowners treat this metric as an HR figure - something from the realm of "soft management" with no bearing on real money. That is a fundamental mistake. Retention Rate is a leading indicator of OPEX. It predicts cost stability 6-18 months before the numbers appear in any report. That is precisely why every professional fleet manager must keep it at the center of their dashboard.
In this article we will examine the mechanics of this relationship - from OPEX structure to the investment logic that smart shipowners and banks are already beginning to embed in their decision-making.
Crew Costs within OPEX: Numbers That Are Inconvenient to Ignore
Let us start with basic arithmetic. A typical OPEX breakdown for a mid-size tanker (Aframax / Suezmax) looks roughly like this:
| OPEX Line Item | Share of Total OPEX |
|---|---|
| Crew costs (wages, repatriation, benefits) | 35-45% |
| Maintenance and repairs | 20-25% |
| Insurance (P&I, H&M) | 10-15% |
| Provisions and vessel expenses | 5-8% |
| Management and administration | 5-8% |
| Other (communications, classification, ports) | 5-10% |
Crew costs are the largest and simultaneously the most volatile line item. This is precisely where the main trap lies for those who look only at the "wages" line.
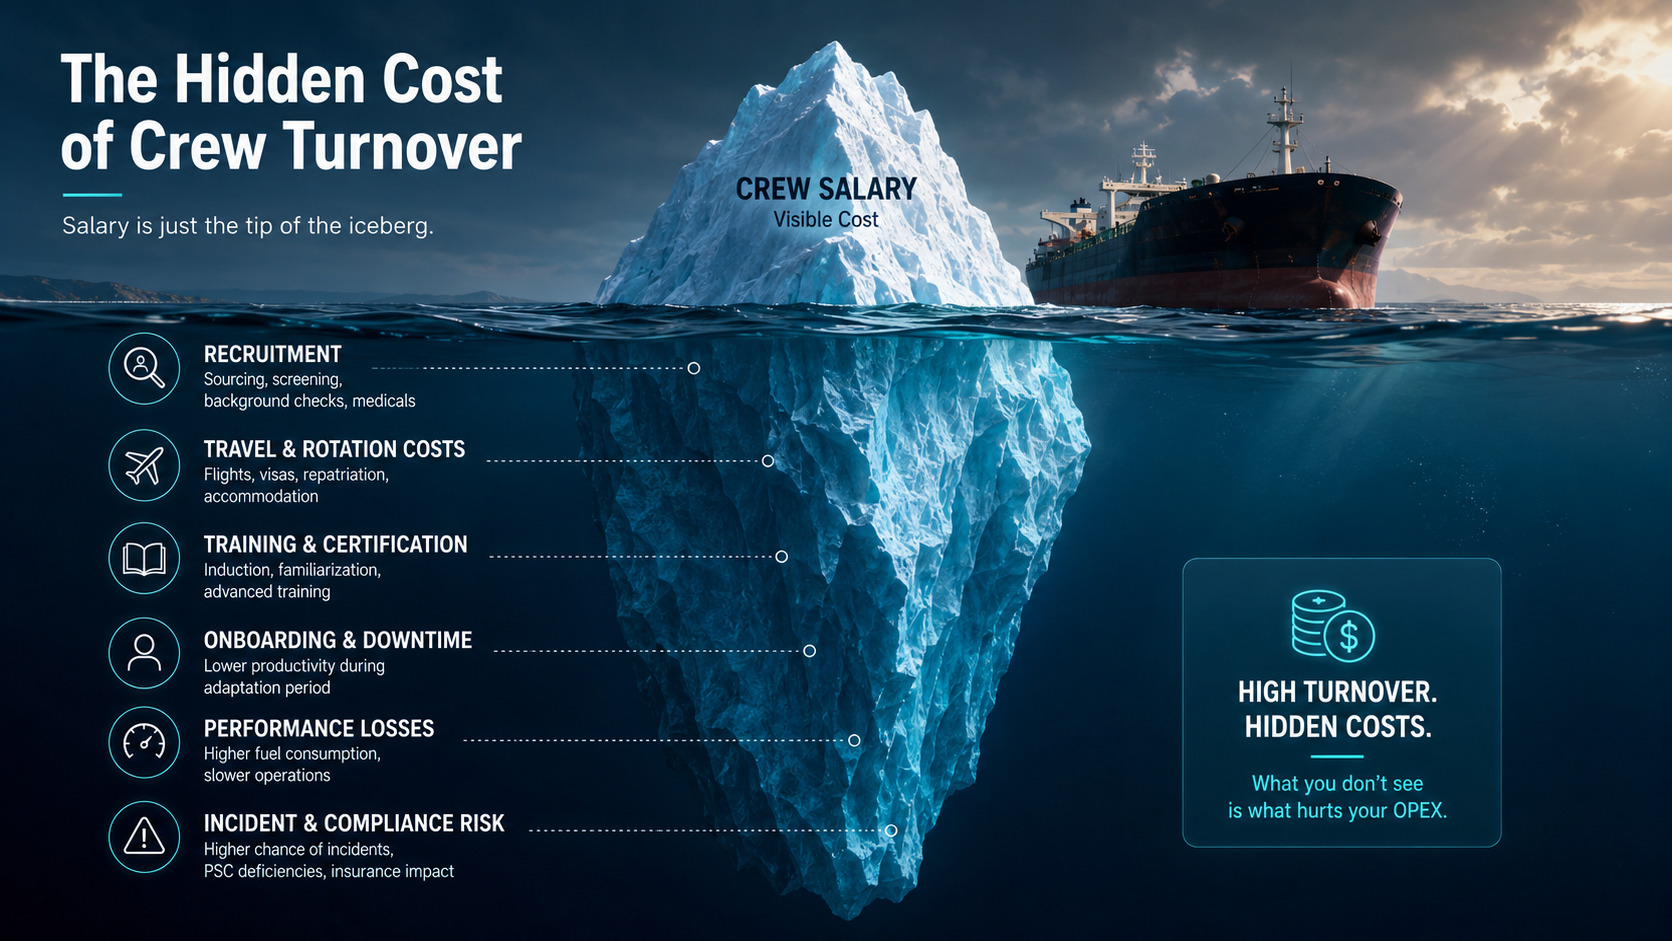
Because the true cost of crewing is significantly broader. Here is what typically falls outside the standard budget:
- Recruitment: search, document verification, medical examination of the candidate
- Repatriation and travel expenses with every crew change
- Certification and additional training for a new crew member to meet vessel-specific requirements
- Onboarding: the adaptation period during which a new officer is not operating at full efficiency
- Productivity losses during the transition period - excess fuel consumption, slower operational tempo
- Risk of incidents within the first 30-60 days of a new crew member joining the vessel
The visible part of the iceberg is wages. The invisible part is everything else. And it is precisely the invisible part that turns high turnover from a personnel problem into a slow-motion financial disaster.
Retention Rate - What It Is and How to Measure It Correctly
Retention Rate is the percentage of crew members who continue working with the company upon completion of a standard contract period or within a given reporting year.
The basic formula:
Retention Rate = ((Headcount at end of period - New hires during period) / Headcount at start of period) × 100%
However, calculating a single aggregate figure for the fleet means generating a meaningless average. A professional approach requires segmentation:
| Crew Segment | Target Retention Rate | Critical Threshold |
|---|---|---|
| Masters and senior deck officers | > 85% | < 70% |
| Chief engineers and engine room officers | > 80% | < 65% |
| Ratings (able seamen, motormen) | > 70% | < 55% |
Another common measurement error is conflating voluntary departures with the planned expiry of contracts. For turnover analysis, only voluntary departures or a seafarer's refusal to renew a contract are relevant. Planned rotation is normal. An experienced officer leaving for a competitor is a warning signal.
It is also worth noting the direct link between Retention Rate and compliance risks. High officer turnover correlates with:
- Increased deficiencies during PSC (Port State Control) inspections
- Deterioration of the CII (Carbon Intensity Indicator) rating due to less efficient navigation
- Elevated risk of crew-error incidents
- Issues during SIRE and CDI audits - which directly limits the vessel's commercial opportunities
The Mechanics of Impact: How Retention Rate Destabilizes or Stabilizes OPEX
Let us translate turnover into concrete figures. Replacing a single senior officer (chief officer or chief engineer) costs a company an amount that is rarely publicized. Realistic market estimates are as follows:
| Cost Item for Officer Replacement | Approximate Cost (USD) |
|---|---|
| Recruitment and administrative expenses | 1,500 - 3,000 |
| Flights, visas, repatriation of predecessor | 2,000 - 5,000 |
| Reduced productivity period (2-4 weeks) | 4,000 - 8,000 |
| Incident risk / excess fuel consumption during transition | 2,000 - 15,000+ |
| Total (excluding incidents) | 10,000 - 20,000+ |
Now multiply that by the number of replacements. A fleet of 10 tankers with a Retention Rate of 60% instead of the target 85% means an additional 15-25 unplanned officer replacements per year. That is between $150,000 and $500,000 in hidden losses - losses that do not appear in the "crew costs" line but are spread across the entire OPEX structure.
Beyond direct losses, there is the performance curve to consider. A crew that has worked together through 2-3 contract cycles demonstrates:
- 3-7% lower fuel consumption through more precise navigation and trim optimization
- Fewer deficiencies during technical inspections - due to familiarity with the specific vessel
- Shorter turnaround times in port - greater efficiency during cargo and ballast operations
- Lower frequency of minor incidents and near-miss events
There is yet another aspect that rarely makes it into analytics - reputational OPEX. Insurance companies (P&I clubs and H&M underwriters) assess a shipowner's loss history and safety record. High turnover correlates with increased incident rates - and therefore with rising insurance premiums. This effect does not appear immediately. That is precisely why we speak of a time lag: the impact of turnover on OPEX becomes visible 6-18 months after the Retention Rate starts to decline. By that point, correcting the situation is significantly harder and more expensive.
Retention Rate as an Investment Signal
Now let us examine the same metric through the eyes of three different market participants.
The shipowner's perspective. Retention Rate is an indirect quality rating for the ship manager. If the management company fails to retain crew, it means one of two things: either working conditions are below market standard, or shore-based support is inadequate. Both scenarios are signals to reconsider the relationship with the manager.
The bank and investor's perspective. When structuring vessel financing, lenders evaluate quality of management as one of the covenant factors. Retention Rate could become a standard metric in a credit memorandum - on par with technical KPIs and off-hire history. This has not yet become an industry standard, but best practices are already moving in that direction. A bank financing a fleet with a chronically sub-65% Retention Rate is taking on hidden operational risk that is not reflected in the cash flow model.
The time-charterer's perspective. For a charterer, crew stability means predictability of performance. A vessel with a stable crew is less likely to fall behind schedule, less likely to encounter problems during SIRE/CDI inspections, and less likely to generate commercial risks. This is especially critical on long-term time-charter contracts, where the vessel's track record directly affects the likelihood of renewal.
Consider a model example. Two identical Aframax vessels, built in 2019, same flag, same class. The difference lies in the quality of crew management.
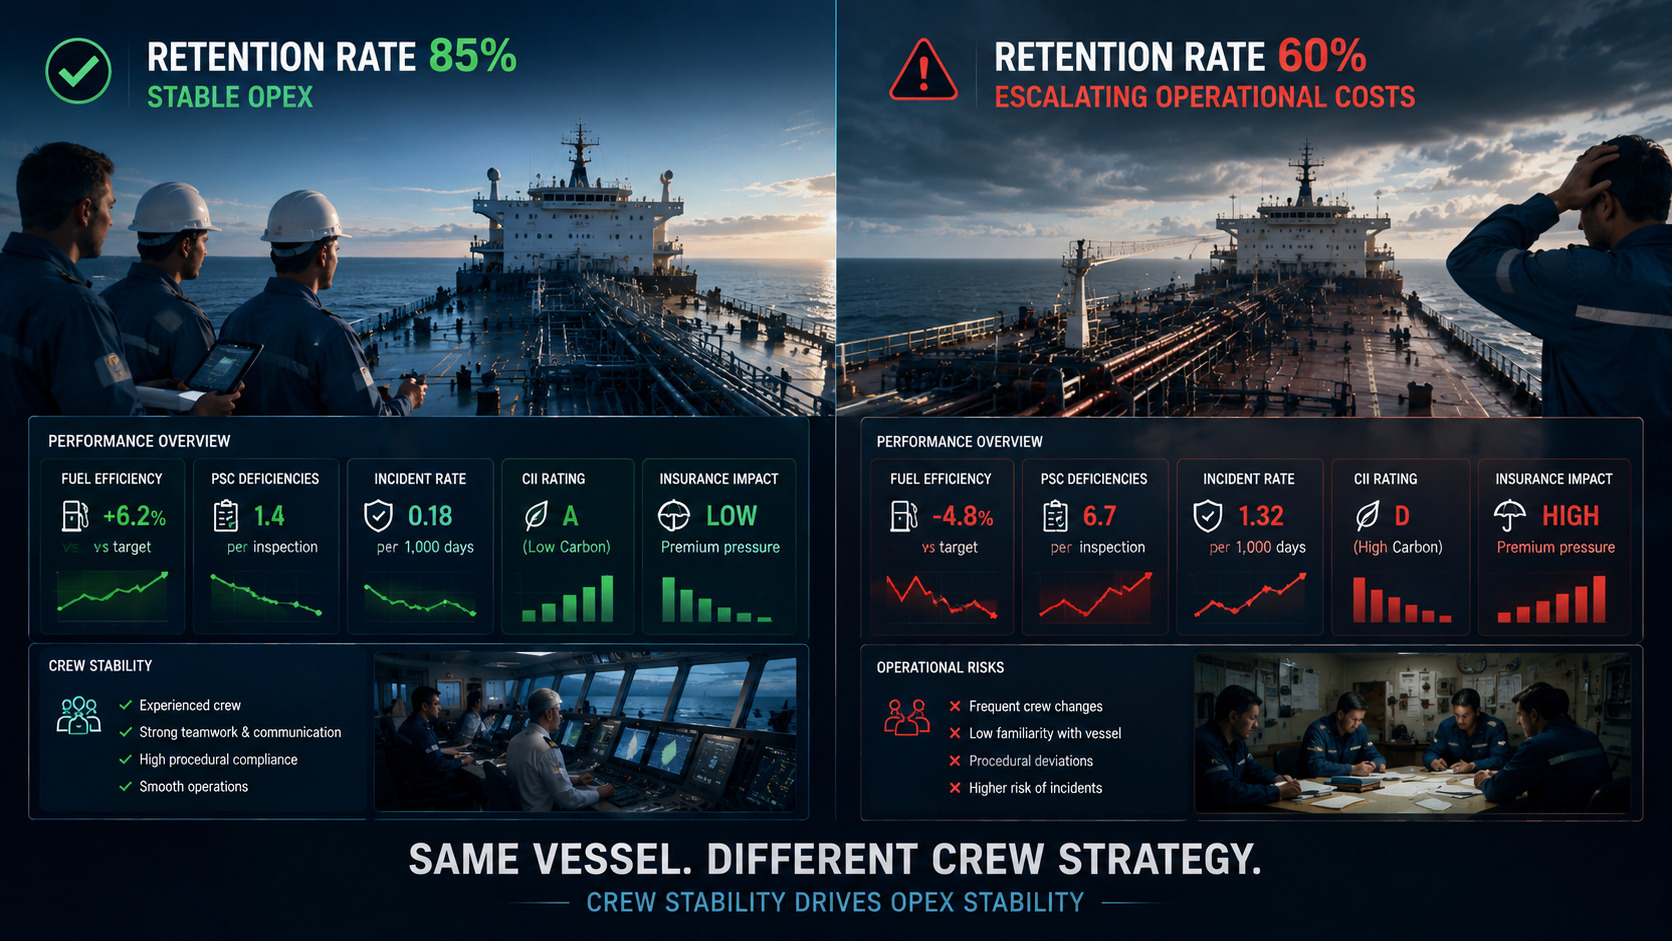
| Parameter | Vessel A (Retention Rate 85%) | Vessel B (Retention Rate 60%) |
|---|---|---|
| Officer replacements per year | 2-3 | 6-9 |
| Direct rotation costs | ~$30,000 | ~$120,000 |
| PSC deficiencies (average/year) | 0.8 | 2.5 |
| Fuel overconsumption vs benchmark | -2% | +5% |
| Insurance premium (H&M, relative) | Baseline | +8-15% after 2 years |
| Cumulative impact on OPEX over 3 years | Within budget | +$400,000 - $700,000 |
Two identical vessels. Three years. A difference of half a million dollars - solely due to different levels of crew management quality. That is what an investment variable looks like.
What Actually Retains Crew (and What Does Not Work)
It is important to address a common misconception here. Many management companies believe that officers can be retained with money. That works - but only up to a certain point. Salary is a hygiene factor. It must be competitive, or people will leave. But once it reaches market level, further increases have almost no impact on loyalty.
What actually retains experienced seafarers:
- A career track. The understanding that the company recognizes their growth. A clear path from second officer to chief officer - with timelines, criteria, and real internal precedents within the organization.
- Quality of shore-based interaction. How quickly the shore team responds to technical requests. How problems with documents, provisions, or equipment are resolved. The master at sea must feel supported by the office - not blocked by bureaucracy.
- Modern training tools. VR training programs, simulator access, distance learning opportunities - these are not merely a "nice bonus." They signal to the seafarer that the company is investing in them as a professional. And that does more for retention than many people realize.
- Psychological climate. Treating crew as people, not as a "resource." This is intangible but measurable - through eNPS (employee Net Promoter Score) and through word of mouth in seafaring communities.
Special attention should be given to the role of the shore team - superintendents, fleet managers, crewing officers. In practice, a master's loyalty is not to the vessel's flag or the company's name. It is to a specific person ashore who helps solve problems. This means that the quality of shore-based management directly determines the Retention Rate across the entire fleet.
This integrated approach - a platform where the shore team, crew training, and technical support all operate within a single framework - is the foundation of professional crew management. We are convinced that this is not merely an organizational convenience, but a strategic competitive advantage.
How to Integrate Retention Rate into Fleet Management
Retention Rate does not work in isolation. It must be part of a KPI pyramid in which every metric is connected to a financial outcome.
We propose the following structure:
- Financial level: OPEX per vessel per day, TCE (Time Charter Equivalent), variance from budget
- Operational level: Technical availability, number of PSC deficiencies, fuel consumption vs benchmark
- Crew level: Retention Rate (by rank), time-to-fill for vacancies, share of officers on second or subsequent contract
- Compliance level: CII rating, SIRE/CDI results, number of near-miss incidents
A minimum dashboard for a shipowner who wants to monitor crew performance without getting into the details:
| Metric | Monitoring Frequency | Intervention Trigger |
|---|---|---|
| Retention Rate (officers) | Quarterly | Drop below 75% in a quarter |
| Average time-to-fill for officer vacancy | Monthly | More than 14 days |
| Share of officers on 2nd+ contract | Quarterly | Below 50% |
| PSC deficiencies per inspection | Per event + quarterly | More than 1.5 deficiencies per inspection |
| Crew cost per vessel per day vs budget | Monthly | Variance exceeding +10% of plan |
An important practical point is integration with the budget cycle. The prior year's Retention Rate should serve as an input parameter when planning crew costs for the following year. If the company anticipates a decline in Retention Rate, the rotation budget must be set at a factor of 1.3-1.5 above the standard. This is known as the crew stability index in budgeting - and it is what distinguishes professional ship management from reactive, after-the-fact management.
Conclusion
Retention Rate is not about how much seafarers "enjoy" working for your company. It is about how much money you lose every time an experienced officer leaves for a competitor. About how the quality of your shore team translates into excess fuel consumption and rising insurance premiums a year and a half later. About why two identical vessels produce different financial results in the same market.
A shipowner who manages Retention Rate as an investment variable manages OPEX as a professional. They do not fight fires once an experienced master has already handed in their notice. They create conditions in which that master never considers leaving.
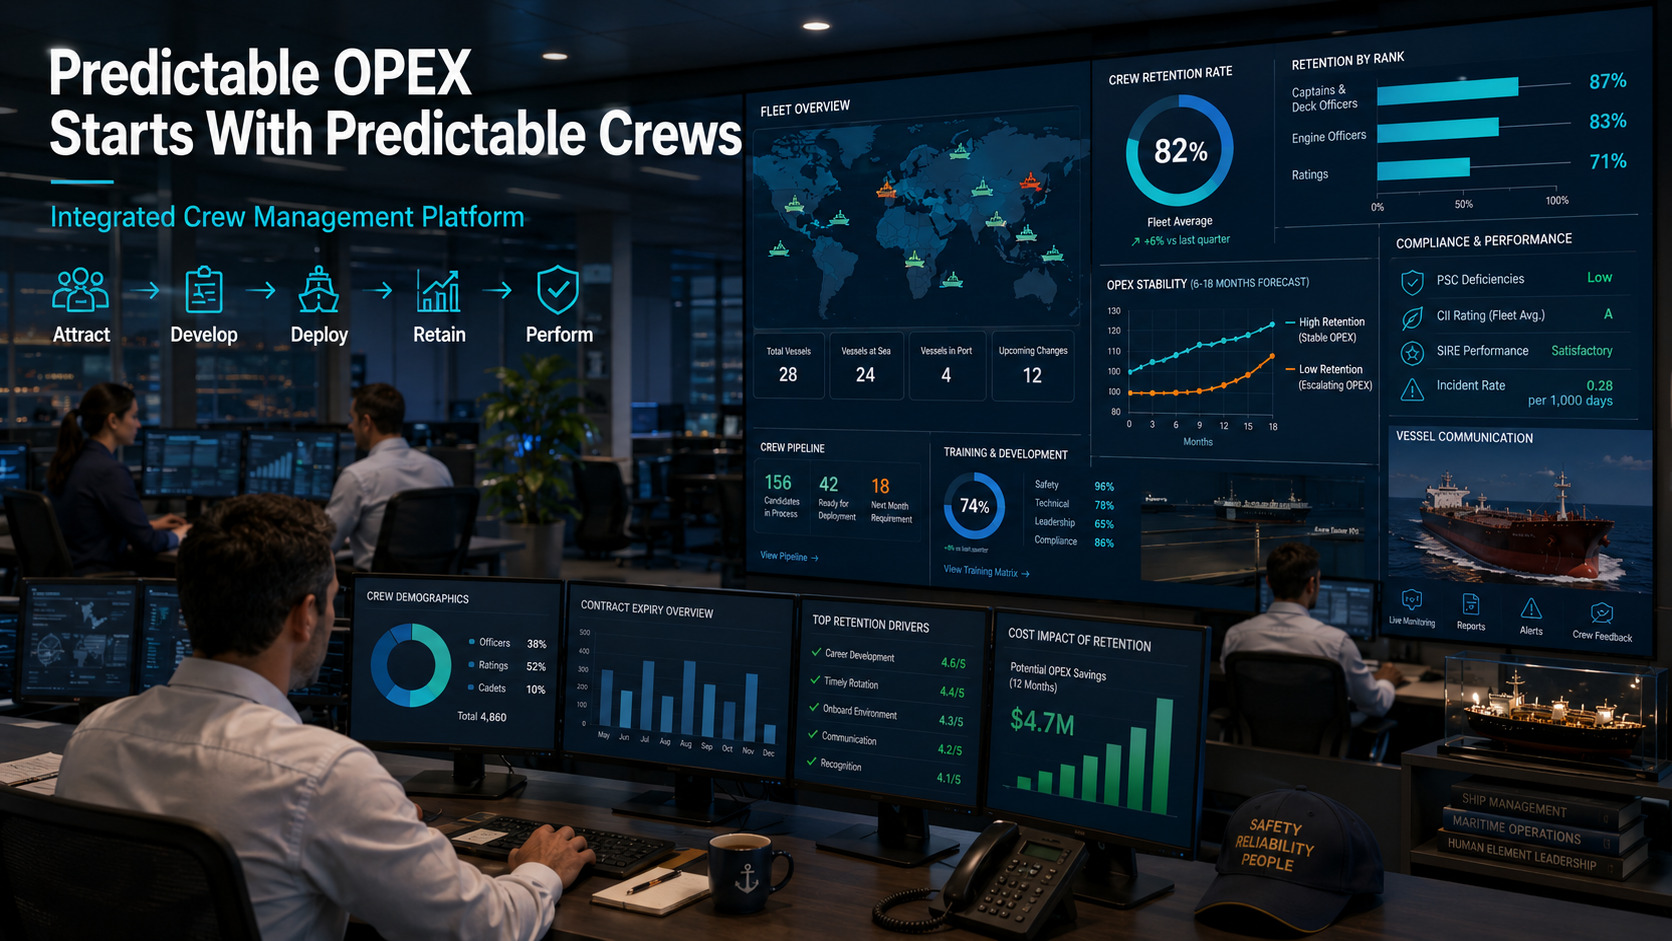
Achieving this requires an integrated system - one where technical management, crew management, and the shore office function as a single organism rather than three separate departments communicating by email. Predictable OPEX begins with a predictable crew. And a predictable crew begins with a properly built management platform. There is no doubt about it.


